
Gold and Silver: Lower Levels Still Likely

As we followed through down to our target region for wave (v) of 5 of iii this past week, the market seems to have found a bottom where we expected last weekend, and has started back up on Friday. Ideally, we are now only left with a series of whipsaws as the market finds its long term bottom. And, each time we surge off a bottom, you will have many people claiming that the bottom is in, yet again. But, in my humble opinion, we need at least one more strong drop before we can even reasonably consider the long term bottom being in place. So, strap yourself in.
But, while we follow the up/down machinations over the next 2-5 months, we are going to be seeing more and more people throwing in the towel. In fact, Brian Kelley of CNBC posted a chart of gold that looks like a camel throwing up as a representation of the gold market. And, yes, that is now the sentiment of most gold and miner holders out in the world today. Everyone was so certain of the lows being in and the new bull market about to begin, no one was reading the signs that had us looking lower as we came into 2014.
As for the wave count, based upon the GDX, as Larry White – our Stockwaves Miner’s Analyst – sees it, as well as the potential I see in in the GLD, we have at least one more low to be seen potentially into year end, and possibly even two more lower lows. That second lower low can still take us into the end of the 1st Quarter of 2015, with the low teens potentially being seen in GDX and the lower region of our target box on the GLD between 95-100 as the targets.
So, allow me to explain the difference between the two potentials I am seeing in the GLD, so that you can be prepared going into the end of the year. The more immediate bottoming pattern is suggesting that wave (v) of 5 of III has bottomed this past week, and has met our ideal bottoming targets. (Of course, if we see a lower low in the upcoming week, then that immediate lower low would complete wave (v) of 5 of III). Assuming we do not see a lower low early next week, I am expecting that we are now in the larger wave IV, which should target the 114-116 region in the GLD. Also, I would expect that this 4th wave should take us at least a few weeks, due to the wave degree with which we are dealing. This count suggests that the decline seen after the wave IV corrective rally completes is the final decline before the bull market resumes.
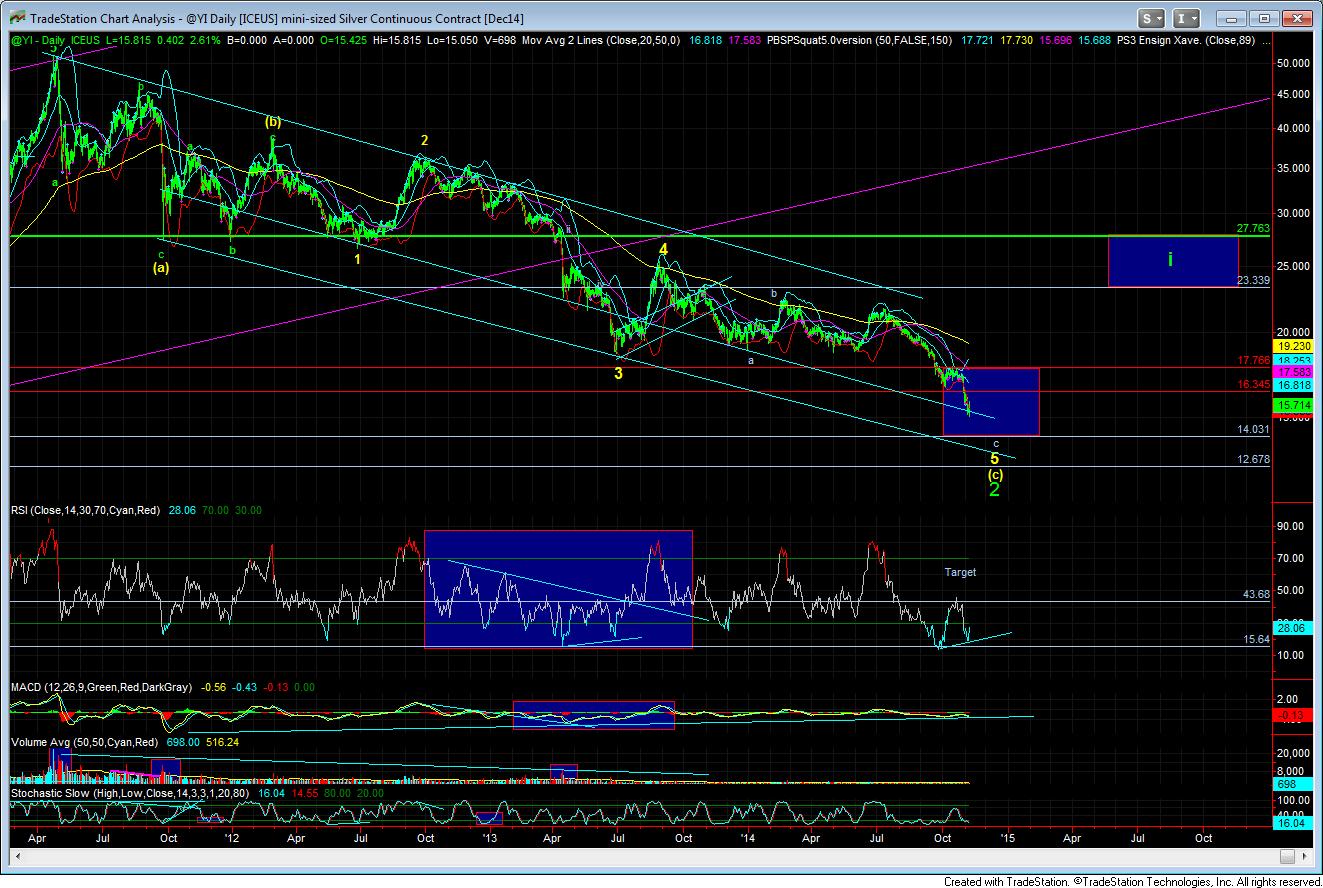
The alternative, more bearish count actually has the larger degree wave (4) having completed in March of 2013, and counting the drop from that high as wave 1 down within this final 5th wave in this c-wave down. That means that the rise into the high in July was a wave 2, as it spiked through the .618 retracement of wave 1, and strongly reversed to the downside. Now, the reason I REALLY like this pattern is because it has been playing almost perfect Fibonacci Pinball on the way down. Wave I if yellow 3 bottomed at the .382 extension, and wave iii of yellow 3 bottomed at the 1.382 extension, which is a very appropriate extensions for iii of 3 in the metals.
So, in both counts, the main target I have for this wave iv is the 114.75-116.50 region, with the maximum extension that can be seen at the 118 region, which would the .764 extension in the most bearish count. And, as long as we remain below the 118.50 region, I am still looking down for at least one more lower low. But, ultimately, we are going to have to treat the next lows as THE lows, which really should be seen by the end of this year. However, should the rally off those lows materialize as a corrective move, we can always hedge our long positions, and prepare for the last drop into the end of the 1st quarter of 2015.
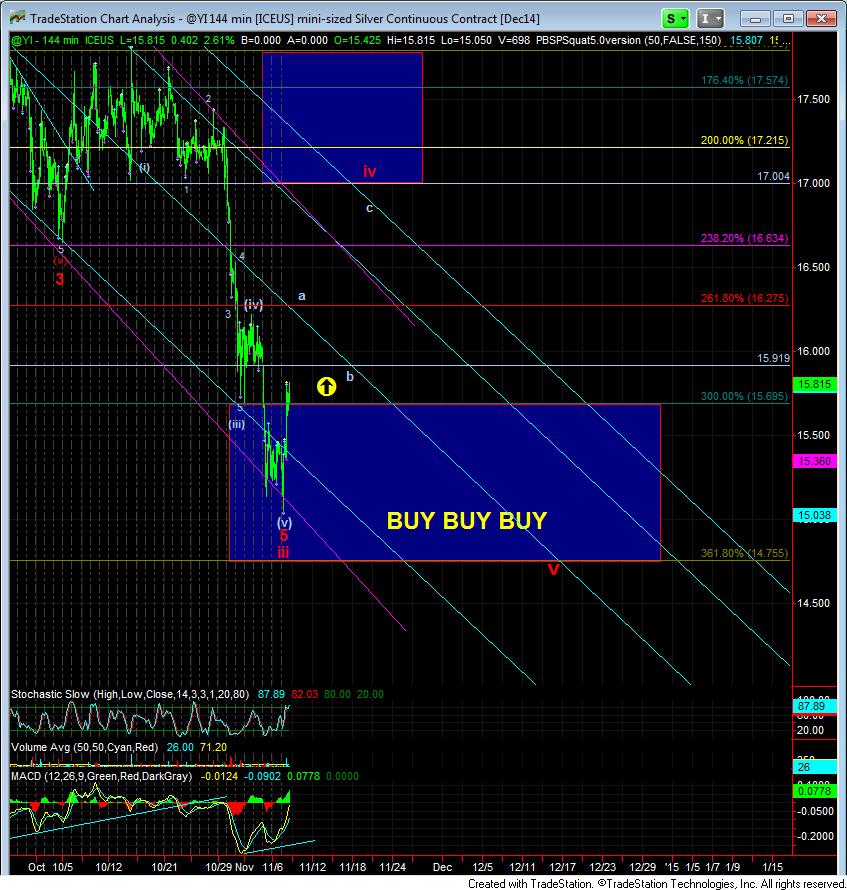
And, as I promised this past week, I am going to simplify the count on silver this weekend. While I can easily “force” a standard impulsive count on silver, it seems to count best as a non-overlapping diagonal for the (c) wave of this larger degree correction. That being the case, it means we are also bottoming in the 3rd wave of this c-wave.
What is also most interesting is that the bottom region of the “buy,buy,buy” target on the 144 minute chart represents where this larger degree (a)=(c) calculation resides, as calculated from the market high of 2011. Of course, we have two more long term Fibonacci regions of confluence below, but I think this is the region one wants to begin their buying if they are wanting to be long in metals for the long term. Below, those levels are the 14.00 region, as well as the 12.75 region. I view that 12.75 region as the maximum extension that is likely to me at this time, and crosses the bottom of the long term trend channel at the end of the 1st quarter of 2015.
Therefore, in my humble opinion, I believe you have a long term buying opportunity in silver between the 12.75-16 region. And, my target for wave I off those lows in the next bull market will be the 23-27 region.
So, as many of you have been asking me to scream from the roof-tops as to when we should be buying into the metals world, the “BUY,BUY,BUY” zone I had on the silver chart was hopefully enough shouting for those looking to move into silver for the long term. Clearly, as I have stated above, we can head lower, but if you are buying long term positions in silver below $16, you should do very well over the coming years.
Again, I would like to remind everyone that Larry White started his miner’s analysis in StockWaves at Elliottwavetrader.net on November 1. His goal is to analyze the major components of the GDX and GDXJ so that we can pick the strongest of the charts, and set ourselves up to outperform those ETF’s in the upcoming multi-year bull phase of the metals.

Fair enough.
But was Garth bullish on Gold from 2002-2011? If not he missed big time. So how is that right????
Completely useless analysis. Gilbert you are all over the map. Why waste your time? Not a single forecast you have made has been correct? If the price goes down, you lower the target. If it goes higher, you raise the target.
Yes Bob M…ding ding ding ding ding….that,s the marbles rolling around…
Yes Dave
There are less then a hand full on this planet that have warned of what is happening these days….Be careful!!
On August 18, 2014 at 9:19 pm,
Lawrence says:
Are you going to give a number $1050 when $1224 is reached, just like last time? It could always be lower. The lowest number I have heard is $250 from Harry Dent a few months ago. No one is going to hit the lowest price, unless by pure luck.
I thought Gilbert’s analysis was spot on. He said gold has another big drop coming , as well as mining stocks. I think he is correct. He built his case for it as well.
Good job Gilbert
What I hate most is the price not moving. Regardless up and down, it always could be useful. As long as in long term gold silver is bullish, it is always good to buy dips. Miners are different animal. I am waiting for them to go bankrupt. Central bank money printing will result in higher cost for companies and they go bust. At same time more people will buy metals. I am willing to hold as long as it takes. If I can hold uranium stocks till the price reverses, physical metal is no-brainer
Why would you continue to buy something that is a losing proposition!? Its in a bear market and its going to chopped in half eventually.
My major holding is silver. I always buy low and sell high and I hold could last many years. The first silver certificate I paid $7 in 2004 and Iater changed to physical. If you don’t believe that money printing will result in inflation, we don’t have common understanding of economy. I bought silver from 7 to 16 and some mining shares. I sold most of them in 2010-2011 . I want to repeat it. People always talk about buy low and sell high and when low comes, they feel it would go lower. When the high comes they have nothing to sell and they buy instead. Now it is blood on the street stage and it is much closer to the lows than to the highs. Just do a calculation, 15.7-0 = 15.7and $49-15.7=$33.3.
Fair enough….I bought at 5-12-17 and dumped the whole lot @$49
But we are in a bear until otherwise… I just listen to a couple of people that have been spot on and I think their success will continue..
Understand, you can choose timing or choose to average down. Choose timing there is danger of a series of buy high sell low. The danger of average down is not been able to hold. Both have problems, one has to choose the best fit. Mining shares are different since they can go to 0.
I haven’t noticed anyone who is spot on. They all flip flop. I cannot afford the trading loss and I am quite busy to focus on minute by minute basis.
History prove that when a commodity reaches a bullish consensus of 97%ish. That’s a long term top EOS. Averaging down on corrections in a Bull market make sense. In a bear nope..I watched people average down on Nortel…
That is why I don’t buy shares. Monetary policy is never so loose. We are going to be 7 th year on 0 interest rate and money supply have quintupled. Something has to give. Either all miners go bankrupt fed comes up with all the supply of gold or price has to go up.
Billy,
Nothing personal but I can’t stand people who say they sold exactly at the top. In this case you nailed it bang on! Well congrats to you but I’d beg to differ. How about you show us some statements lol?
That’s the problem in today’s society. Everyone I talk to or speak to at events/meetings and etc, always tell me they have made a fortune but never tell me they have lost. So I guess everyone’s a hero or winner. Ahhhh!
Wish I’d picked the top in the gold mners the last time around….but it wasn’t to be.
Starting off loading them in the low 1700’s……last lot where sold in the high 1700″s.
managed to unload 1/2 my physical in the mid 1800’s (still have the rest).
It was hard to sit there out of the market & watch it go higher & higher.
looking back I’m not unhappy with my returns.
but I never got that last parabolic move up gold made.
buy low……sell high………….
I agree i find Avi,s analysis far better and accurate than most. People are a little to dermanding wanting an exact figure .
nothing but wiggles and algos now. Riding the 10 day ema’s on the daily. Metals and Miners cant make up their mind. Bull or Bear. Im getting grinded to pieces with the whipsaw.
Just look at the big picture. It has been many, many months GDX traded up on 4 out of 5 days on high volume. The trend has changed and there is a reason. It is not about cycles.
http://stockcharts.com/h-sc/ui?s=GDX
Seriously, it is all about Japan. It is finally cracking after 30 years of irresponsible monetary policy combined with bad demographics. The 10 year JGB went up over 8% today. The Yen is falling and under great stress. This and the international currency flows in and out of the Yen, Euro and USD (ie real data) is much more meaningful than somebody’s interpretation of cycle counts on a chart. If it was really about cycle counts, it could be done on a computer and we would all be rich but give me 10 different Elliott Wave guys and I will give you 10 different interpretations of wave counts.
It is about confidence. If Japan truly falls apart, the grand Keynesian experiment will shown it has failed. Are people really that stupid to think it will work in the US? Maybe so but if only 5 or 10% look for an alternative and give fiat currency and government central bank manipulation the heave-ho, gold is going much higher.
Billy,
How about you share with the audience your gurus you so follow? Let’s put a face to them. This is of course a family and open concept website that promotes itself in educating each other.
I’ve posted a few times….No one wants to here the truth.
JFT from Sprott doesn’t write much..just manages his fund. I usually talk to him when he can take a call.
GOLD is going to be put in the basket of currencies….via the CHINESE…….better make sure you have some.
I don’t see how these silver mines survive? Losing over 20% for every ounce they produce and no action have been taken to protect themselves. Hard to think of anyone who are worse than these managers. Are they just waiting for the day that Wall Street take them over for free?
they just sales some more stock…….on new potential discoveries……….DIG A HOLE, and keep em thinking……….
J. I think that game can be played by explorers since they have not much burn rate. For producers, they need constant cash injection unless it can pay for its operations. With the current share price, it is tough. I will stay away from these guys until they finish shutdown and survive for a while.
He had it right years ago…”sell gold you fools and buy the market”…nice call Garth….too bad all the resource promoters slaughtered their flock….
http://www.greaterfool.ca/2014/11/10/fail-3/