
“Sell In May” Often A Big Mistake Historically

Here is a short post about how the saying “sell in May” is not exactly a good idea. This post was authored by the guys over at Short Takes – click here to visit their site.
A Cute Little Rhyme
Having worked on Wall Street for over twenty years, I have had countless conversations about the seasonal tendency for investors to “sell in May and go away”. Wikipedia describes the concept this way:
“Sell in May and go away is an investment strategy for stocks based on a theory (sometimes known as the Halloween indicator) that the period from November to April inclusive has significantly stronger growth on average than the other months. In such strategies, stocks are sold at the start of May and the proceeds held in cash; stocks are bought again in the autumn, typically around Halloween. It is the belief that it’s better to avoid holding stocks during the summer period.”
Markets Are Not That Easy
Investors like market forecasts because they want to feel like they have some control over what in the real world is a very uncertain future. Investors like seasonal patterns for the same reason. Does it make sense to solely base your investment strategy on any seasonal pattern? Markets take all factors into account, including seasonal tendencies, Fed policy, earnings, valuations, geopolitical tensions, and systemic risk. The list of factors impacting asset prices is almost endless and goes well beyond a cute little rhyme like “Sell in May and Go Away”.
What Does History Say?
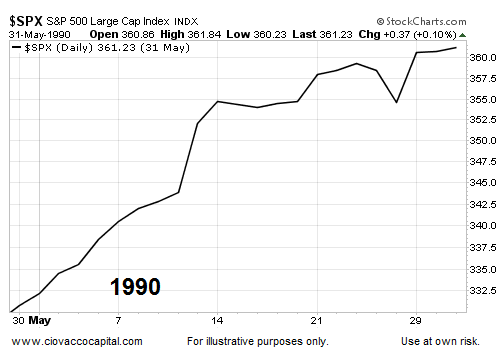
If you sold on April 30, 1990 and sat out the month of May, you missed a eye-popping 9.20% gain in the S&P 500.
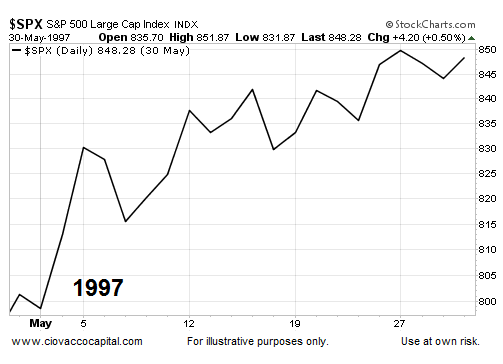
In 1997, stocks returned 5.86% in the month of May, making the “sell in May” crowd very uneasy.
What Does The Bigger Picture Look Like In 2015?
Seasonal patterns can be helpful, but taking a broader view of risk-and-reward easily passes the common economic sense test. This week’s video looks at numerous markets allowing us to peek behind the probability curtain based on hard present-day data, rather than a rhyme.
Back To The History Books
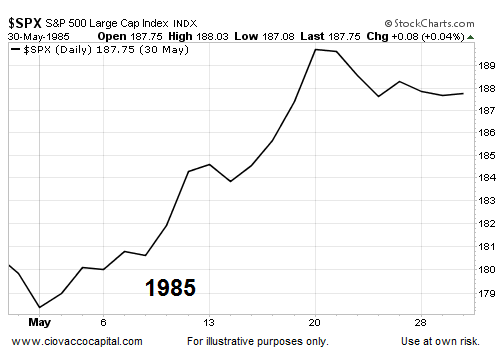
In the spring of 1985, Coca-Cola introduced the “New Coke” much to the dismay of the soft drink consumers. The stock market was a bit more cheerful, posting a 5.41% gain between the end of April and beginning of June.
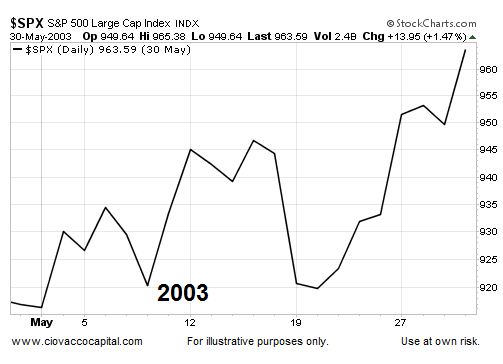
While many were still very skeptical about stocks in the wake of the dot-com bust, the charts were saying “things are looking better”. The S&P 500 agreed by tacking on 5.09% in May 2003.
But, The Market Was Different Then…Right?
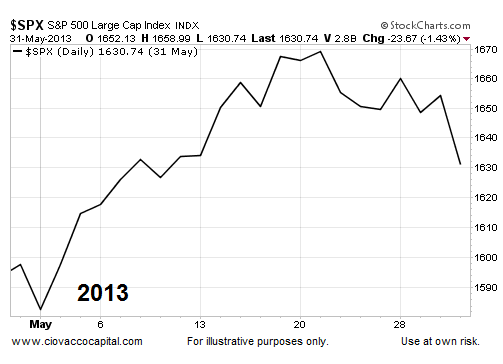
The market is always different, which is why ignoring present-day data and instead relying on the history books can produce very disappointing results. Those who chose to move to cash on the last trading day of April 2013, missed a 2.08% gain in the S&P 500.
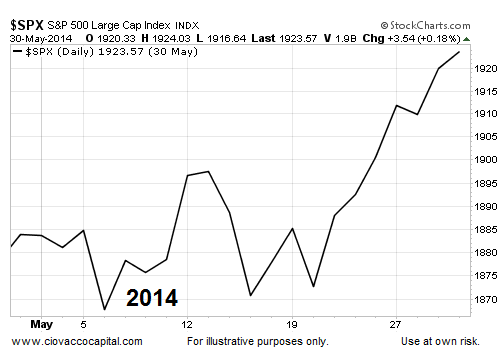
“Sell In May” was not particularly helpful in 2014 either. The S&P 500 advanced 2.10% in May of last year.
Investment Implications – The Weight Of The Evidence
According to moneychimp.com, since 1950 the S&P 500 has been green in May 37 times and red 28 times, with an average change of 0.11%. An average gain of 0.11% is nearly a coin flip, which aligns with the “pay attention to the current data” approach. The current data, as outlined in the video above, is still calling for an equity-heavy allocation. When the data calls for a reduction in our exposure to stocks, we will not hesitate to make the necessary adjustments.
BTW – I trade all year long and don’t totally buy into all the seasonality plays, but the market is made up of many people. If the majority of traders buy into something and there is a probability that over 3-4 months (May-Aug) that things trend down or just stagnate in the summer doldrums, then it is worth considering when mapping out how things may develop. Looking at only May just misses the point and is not a thorough review of the summer doldrums.
get some beach time in before the beaches are closed for the winter…….LIFE IS A BEACH……….. 🙂
Yes I agree Frankjerstein. I’m a big believer in work hard + play hard.
As FLECKINSTEIN says ” the days of back to back downside momentum has stopped”, referring to gold.
the Boot….Frankjerstein
The province of Alberta went to the poles yesterday and “BOOTED OUT” The Conservative party which has run this province for decades, instead they voted in a Socialist party called The NDP or New Democratic party. They are going to stop the keystone excel pipeline, raise corporate taxes for the oil companies, and increase spending. One thing they didn’t mention about The NDP win is we have a Federal election coming up in the fall I believe, and this should give Prime Minister Steven Harper and The Progressive Conservatives a jolt, because The NDP is against war and people are fed up with The Wars.
The boot is in these days. DT
ditto………………THE BOOT………. 🙂
BIG HIT ON THE DOLLAR……down 1.17
update…………..down 1.21
well there goes my cheap European vacation……………… 🙂
Yeah how much did the plane ride from moscow to London go up in Rubles?
Frank, were you storing a bunch of US dollars over in mother Russia or something to pay for airfare? 🙂
YELLEN KILLS THE MUSIC……….valuation to high…sends stock markets down…zerohedge, ….but, heck everyone already knows that.
Yeah, the contrarian in me does not like being on the consensus view, because just the opposite often happens. If everyone things the market will drop on a bad news, then is it already being baked in?
I completely agree that nobody should base their investment thesis on any (1) factor like seasonality, or the Fed, ECB, BOJ and the central banker cartel, or fundamentals and the news feed, or technical analysis (pick your system), or sentiment indicators, or political events…… They all should be taken into account.
This article was interesting, and brought up some good examples, but was weak in my opinion in disproving the seasonal tendency of “Sell in May and go away”.
It used 1985, 1990, 1997, 2003, 2013, and 2014 – S&P 500 Large Cap index as the reason why the seasonal tendency doesn’t hold up. Well what about 1986, 1987, 1988, 1989, 1991, 1992, 1993, 1994, 1995, 1996, 1998, 1999, 2000, 2001, 2002, 2004, 2005, 2006, 2007, 2008, 2009, 2010, 2011, 2012?
If the last 2 year years were both up in May, I wouldn’t use that as proof this one is going up in the S&P either, because the market is far more skittish at its current lofty levels than in 2013 or 2014, and the US economic data has been coming in weak. The jobs report (if it is ugly) could send the S&P down further and people will still consider the cute little rhyme in the back of their minds.
Also the point was covered well in here that many larger investors only hold equities for a portion of the year and skip the summer months STARTING in May, and they’re out for June, July, and sometimes even August. Everyone piles back in right before or after Labor Day as the ritual goes. So just tracking the May (37 green versus 28 red with an average change of .11% does not take the May/June/July trend into account. I don’t have the time to research it, but something tells me if they had done a 3 month summary for (May/June/July) into account, versus just the month of May, it would have been far more skewed to the Red than the Green.
They were very selective in how they covered this topic, but again, it was a good article and I agreed with many of the points and misnomers they covered.
Thanks for posting it Cory!