
Household Debt and Business Cycles Worldwide

From the National Bureau of Economic Research NBER comes this finding that I think makes sense when you take a step back and look at the big picture. Simply when household debt is increasing when compared to a country’s GDP this is signaling a weakening economy. The research found that household debt is a better predictor of downturns that the debt of non-financial firms.
Here are some excerpts from the NEBR’s research. Below the excerpts you will find charts that outline the trends in a number of countries in terms of household debt to GDP.
Click here to visit the NEBR website for the full report.
An analysis of business cycles in 30 mostly advanced economies finds that burgeoning household debt is a strong indicator of an impending economic downturn.
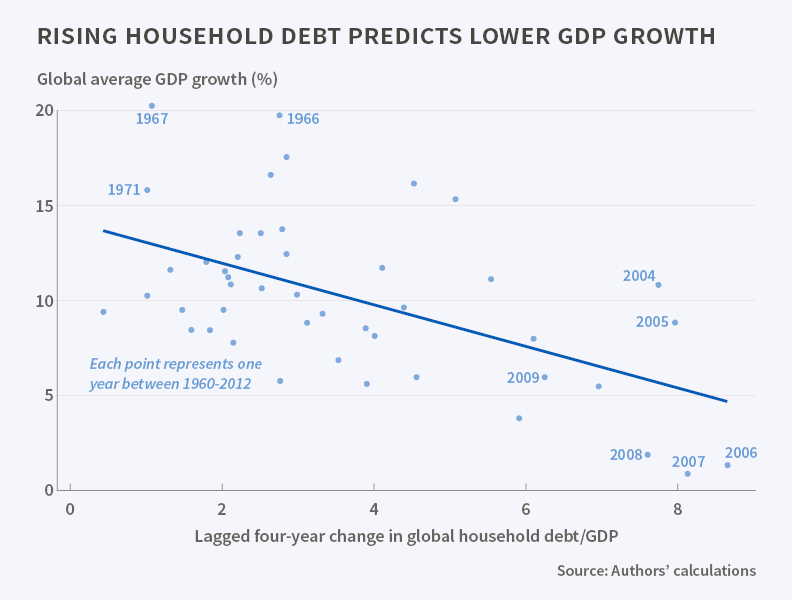
An increase in household debt in relation to a country’s GDP is, at least in the short to medium term, a strong predictor of a weakening economy… The researchers use slowing growth and rising unemployment as key indicators of weakening. They find that the household debt factor is a better predictor of downturns than the debt of non-financial firms.
They find that a rise in household debt, largely produced by more readily available credit, is a valuable forecaster of a contracting economy, citing as a prime example the growth of household debt in the early to mid-2000s and the slowing of global growth in the latter part of that decade.
The researchers see lower credit spreads and increases in risky debt as primary factors driving the rise in household debt. The availability of cheap credit spurs borrowing to finance higher consumption. In particular, household spending as a share of income rises during household debt booms, as do total imports and the share of consumption goods in total imports. The expansion in household debt is followed by a sharp slowdown in GDP, consumption, and investment growth. This slowdown is not anticipated by professional forecasters at the IMF and OECD, giving household debt the ability to predict growth forecast errors. The expansion in household debt is also followed by a sharp reversal of the current account balance, driven primarily by a fall in imports. If a number of countries are experiencing household debt growth at the same time, net export margins are unlikely to help an individual country export its way out of a downturn. Countries with a household debt to GDP cycle in line with that of the global debt cycle therefore see even larger declines in future output growth following a rise in household debt.
The researchers state that their approach to relating changes in household debt to subsequent GDP would have predicted a fall in global GDP growth during the 2007 to 2012 period. “The Great Recession was not an extreme outlier,” they write, but “followed a pattern we would expect given the tremendous rise in global household debt that preceded it.”
They acknowledge that predicting economic developments is prone to error and miscalculation, but argue that their study nevertheless suggests that considering periods of rapid growth in household debt in relation to GDP is a useful means of foreseeing periods of economic retrenchment.
—Matt Nesvisky
Here are the charts for a number on countries. All these charts are courtesy of the Trading Economics Website – time frames are different due to lack of data.
USA – For the last 20 years.
source: tradingeconomics.com
China – For the last 10 years
source: tradingeconomics.com
Canada – for the last 20 years
source: tradingeconomics.com
Japan – for the last 20 years
source: tradingeconomics.com
Euro Area – Data back to 2000 is available
source: tradingeconomics.com
Overall we can see that China and Canada are the counties that are on an uptrend and have been for a number of years. The US and Euro area have seen a nice fall-off since 2010.
It is important to assess where we think these trends will continue throughout the year as that is what can forecast a struggling economy. Canada looks to be in the weakest position with a household debt to GDP ratio of over 90. This ratio continues to rise and combined with a slowing economy (thanks in large part to struggling commodities) the outlook is not good.
China is another concern with its slowing economy and appetite for debt. While the ratio in sits slightly under 40 the country has more fundamental problems that need to be considered. Still considered an emerging market China is a major concern for me.
The US managed to bring down its ratio arguably by allowing homeowners to default throughout 2008, 09 and 2010. Unfortunately the ratio recently turned back up flashing warning signs. Will the recent increase in interest rates do anything to slow borrowing? Probably not especially from the household level which will make eyes turn back on another potential housing bubble.
Read into these charts what you want but the fact remains, in a slow growth world GDP growth will not help to decrease these upward trends.