
Wednesday and The Doctor is In.

Click download link to listen on this device: Download Show
The DJIA, Nasdaq and the S&P continue the slight Tuesday rally.
As mentioned at the end of this editorial, I am increasing my position in Corvus Gold according to my normal disclosure menthods.
CMC; I right now I own about 4 major positions that I’ll hold for the duration. There are other stocks that I’m waiting to bottom that I will take positions in for the long haul. During this time I’ll occasionally purchase for a short term trade but am not doing that as much as before since I feel it’s getting time for a long term hold in some of these.
Gold has continued to rally in January, as mentioned it would coming out of that double bottom in December from much lower prices.
JNUG went up and hit $28 today as predicted. Cha-ching!
On January 26, 2016 at 12:39 am,
Excelsior says:
JNUG looking peppy. Heading to $28. May make it to $32 before this rally tops.
http://stockcharts.com/h-sc/ui?s=JNUG&p=D&yr=0&mn=6&dy=0&id=p27381024347
Good on ya, Excelsior… I’m a bit late to that party. I’m thinking JDST when gold hits 1134.
yeah, I just did a little swing trade from last Thursday at $22.70 and I had a limit order that sold it today at $28.01.
I’ll take a 23.4% profit in 4 business days…….any day. 😉
There may be some room to run but I wanted to take some chips off the table and deploy the funds in other areas.
As for JDST I hear ya for when this rally tops out. My target from late December, when I mentioned gold would not correct down, but would rally in January up to the descending wedge trend-ling was $1142-$1146. I’m not sure if there is enough juice left to get it there or not. $1123 was first resistance, so we’ll see how it goes.
Out of curiosity, I saw you mention that $1134 number before. How did you come up with that target, as that was not a level I’ve been watching. Is it a fib retracement or a MA?
The 200 MA. I think it’s going to tap there.
There’s also a hidden pivot at 1130.
Thanks. I figured that was what it was, and you’re probably correct on that call. Maybe I’ll enter a first tier of a position in JDST at $1134, and then if Gold makes it to $1142-$1146 zone, then I’ll go in on a second tier.
Since late December I’ve been using the $1142 target at the upper trend-line in the descending wedge pattern as my guide for where Gold may smack it’s head; and there is a prior peak that is significant to me at $1146.
If it does make it up that high, I would expect it to turn down into the Spring as Doc expects. While the Gold miners may or may not put in new lows, I think that the Jrs would likely pull back significantly enough for a swing trade in JDST.
I’m thinking after gold tops here, it heads down to 1041. The stock exchange should help take the miners down. That’s why I like JDST. It was real good for the last two weeks while stocks were falling. Even when gold was flat.
Agreed.
My call was good today………………I say…..”I think it(gold ) would go up”…. 🙂
Yes absolutely FFM CCF – You and Brian and I were on the $1111-$1112 target. 🙂
If you recall this happened to match the Morris Hubbart target of where the “Cup & Handle” or “Saucer” patterns rim was at $1110 that needed to be exceeded.
See again 1:50 on Morris’s video
http://www.superforcesignals.com/video/2016jan21gold/2016jan21gold.html
__________________________________________________________________________
On January 22, 2016 at 12:33 pm,
Frank from moscow CCF says:
I like that cup and handle on the gold chart……….needs to break the 1110…….1112, and it off to the races……………CCF….and of course…jmho
On January 22, 2016 at 12:37 pm,
Excelsior says:
Yes sir. Remember $1111….Gold was having a hard time punching through on the first few attempts, but this is normal where there is heavy resistance. When it punches through the rim of the cup or the saucer next time, the rally should get some legs.
On January 22, 2016 at 12:41 pm,
Frank from moscow CCF says:
IBJ….use to say……when watching the cup and handle, it needs to be 1/8 above the handle to confirm(or at least something like that). I was thinking of saying that 1111, but, I thought 1112….for security …. 🙂
On January 22, 2016 at 12:51 pm,
Excelsior says:
Very prudent. We’ll go with a break above $1112 then…
As a short term trader, I am in agreement with Cory. This bounce since 1/20 has been very weak – thus far. Can the market top out this bounce right here and head down? … Perhaps Apple’s earning report after the market close would be a bad one?? Just guessing…
This article from Clive Maund makes a great deal of sense to me and I’ve been using his outlook on the general markets for a while. Food for thought:
___________________________________________________________________
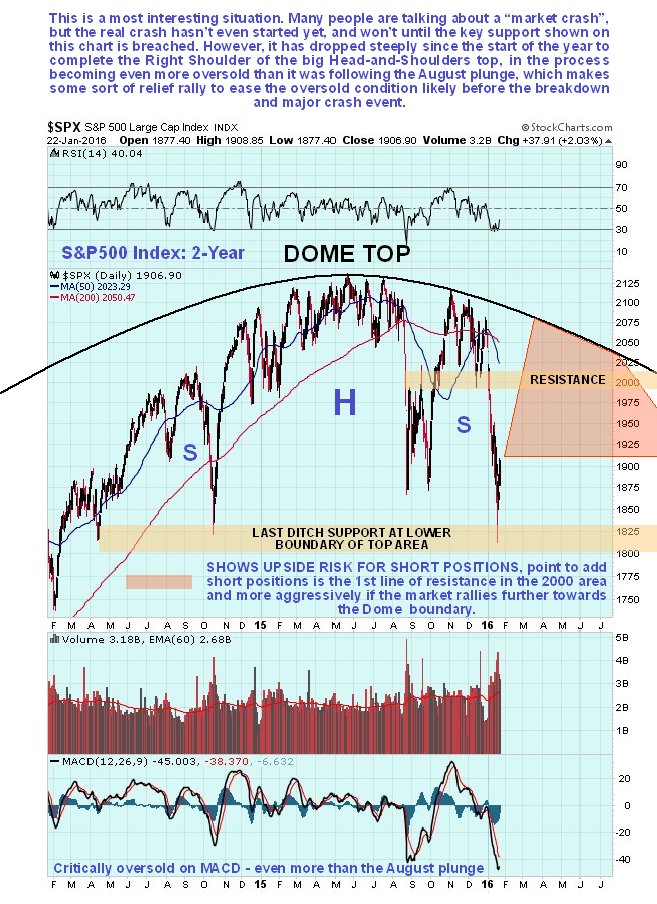
CHARTING THE CRASH – HOW FAR WILL THE BOUNCE GET?…
January 24th, 2016 – Clive Maund
Clive Maund – Dome Top Chart in S&P 500
http://www.clivemaund.com/charts/spx2year230116.jpg?PHPSESSID=da4351c0e6e96ac80d4d74b7b71d2494
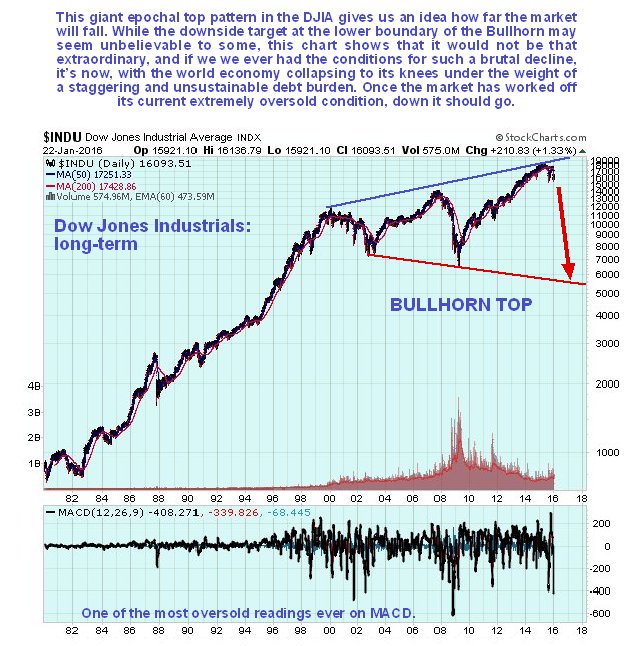
Clive Maund – DOW Bull Horn Top – Chart
Not real bad, but then again certainly not great. Earnings above estimates, but lower sales.
So, is what you are saying, is that gold and silver will run for a little more prior to going lower in the Spring and the the conventional markets will run a little also, but will be going down to new lows? If so, is it a good time to short the conventional market again or to wait a little longer? Will silver drop to new lows in your opinion or just head lower in the Spring? I have a significant position in SLV and was wondering if it would be prudent to sell into strength then wait until it corrects lower before getting back into silver? Thanks for your input.
Pardu, I believe the PMs get a bid here for another week and then may just levitate toward the end of February. January and February are often decent months for the PMs and March is not—-I believe that holds again this year. Then we’ll have to watch the aggressivness of the sell off end of February into spring as mentioned to see if we start a significant march (PUN?) down to 1000 gold or if the PMs gently slide sideways to down. I’ll be able to possibly predict that when the slide starts. How the conventionals look on the chart at the end of month will be very informative for what kind of move to expect going forward into February. Let me put it this way for silver—based on a very important technical I watch, in 2-3 weeks silver should not be higher then it is right now—I hope this gives you some guidance on what to do with your silver position. We might see a little more upside on silver for 2-4 days. I hope this helps. By the way, Pardu; you might let me know if I’m correct about the silver move in about 2-3 weeks.
I agree Doc.
__________________________________________________________________________
On December 28, 2015 at 2:18 pm,
Excelsior says:
Doc, do you place any credence on the idea that Gold has double bottomed in the $1045.40 area and may actually rally in the month of January?
Historically the beginning of the year Jan/Feb is a strong seasonal period for the PMs.
On December 28, 2015 at 2:21 pm,
Excelsior says:
We were discussing yesterday that Gold may rally up to the upper trend-line in the falling wedge pattern…..somewhere in the $1142-$1146 zone. It seems like January would be when that would happen, but I know you’ve been anticipating a grind down to a lower low in Jan.
Just curious what you think about the idea that Gold is ready for a mini-rally for a few weeks, instead of the decline.
On December 28, 2015 at 2:46 pm,
RICHARD (DOC) says:
Excelsior; excellent point and I wouldn’t be surprised at all if your scenario happens—after a rally, the odds could be a final move lower into spring/summer. My thoughts favor what you just mentioned.
On December 28, 2015 at 4:48 pm,
Gabriel says:
Again, this is what I am expecting …
Doc, do you still think RGLD is going under 25? I got excited this morning and bought it@27.5. I was more worried it would go up without me than that it would go down with me on board.
BB; was it RGLD that I said awhile back that it would hit 25? I feel the odds are VERY HIGH you have not missed anything in this short term spike. Personally, I wouldn’t chase this move—-not investment advice.
By the way Bonzo, RGLD has a chance for a little more of a move this week.
Yes, Doc, you did say RGLD could hit 25 when it was over 30, and it did. I don’t know what happened to me this morning, but I got excited and bought some @27.5. After it goes up more this week, how low do you now think it could fall this spring? I bought some at 41 years ago and rode it to over 100, and then all the way down to 25. I wish I’d known you when it was 100.
Bonzo, the bad news is that RGLD will close below the 200 month MA at the end of January. That tells me a sub 20 price is easily obtainable. Let me know when it gets down there and I’ll try to tell you if lower prices are in the offing.
Now I wish I hadn’t bought it, as I’ll probably ride it down.
In comparing the HUI with Gold today, it seems that more than a few have decided to take some short term profits off the table. However, gold seems to be clawing its way higher and there may be some disappointed traders if gold simply continues on up tomorrow. I feel it has the capacity to hit 1140 before either correcting a bit or stabilizing near that level. JMO
Big Al,
You’re thinking of buying Corvus.
Why?
January 26, 2016 – 8:00 AM EST
CORVF 0.2913 -0.0017
KOR:CA 0.41 0.005
Corvus Gold Announces Latest Exploration Results from Three New Target Areas on its North Bullfrog Project, NV
Highlights Include:
Savage Target: 3.1m @ 2.1 g/t Gold & 178 g/t Silver
Rhyolite Zone: 6.1m @ 1.9 g/t Gold & 10 g/t Silver
North YellowJacket Zone: 3.1 @ 1.25 g/t Gold & 2 g/t Silver
VANCOUVER, Jan. 26, 2016 /CNW/ – Corvus Gold Inc. (“Corvus” or the “Company”) – (TSX: KOR, OTCQX: CORVF) announces additional exploration results from its 10,260 metre 2015 exploration program which tested both new and resource expansion targets across the North Bullfrog property. These most recent results targeted the peripheral boundaries of the existing Sierra Blanca/YellowJacket deposit at Savage, along the northern extension of the YellowJacket vein system, as well as follow up drilling at the new Rhyolite zone (Table 1 and Figure 1). These results highlight the expected expansion potential in a number of areas around the main deposit and will be utilized to guide the next phase of exploration planned for this spring.
Savage Target: Three holes were drilled in the main Savage target immediately adjacent to the southern portion of the Sierra Blanca deposit. Thick oxide zones of mineralization were identified and at a depth of ~350 metres in hole NB-15-273 a higher grade (3.1m @ 2.05 g/t gold and 178 g/t silver), copper rich zone was intersected with textures indicative of a higher temperature mineral system.
In addition to copper grades up to 0.2%, the intercepts had high antimony, tellurium and arsenic numbers, suggesting a possible porphyry/intrusive association. A review of the drill chips from NB-15-274 and NB-11-95 has confirmed the presence of multiple aphanitic-fine porphyritic dacite dikes, suggesting the presence of an intrusive center at depth beneath northern Savage Valley. All three holes at Savage also returned broad zones of low grade oxide mineralization.
Rhyolite Zone: Two drill holes were completed on the Rhyolite Zone. NB-15-266 drilled near hole NB-15-267 had recovery problems through the zone and was not completed to planned depth. Although the hole experienced recovery problems it still returned encouraging grades, although not to the level of hole NB-15-267 (10.7m @ 3.47 g/t Au & 3.6 g/t Ag).
NB-15-276 was a ~30 metres step out drill hole to the northeast. This step-out hole indicates the system is narrowing to the NE with gold grade dropping off and silver grade increasing in that direction (best hit 4.6m @ 10.6 g/t silver). These results are now vectoring future exploration to the SW along the main Rhyolite trend.
North YellowJacket Zone: Four holes drilled in the North YellowJacket extension target 75 and 150 metres north of the currently defined deposit along a projected north-south splay of the vein system. Results indicate the splay is mineralized in the first fence of holes (best hit NB15-272 – 1.5m @ 1.1 g/t gold and 75 g/t silver). However the grade drops off in the last fence to the north. Results suggest the northern extension of the YellowJacket system could be displaced to the west towards Northwest Sierra Blanca, which is planned for testing in the next phase of exploration drilling this spring.
Jeffrey Pontius, CEO of Corvus states… “These initial results with new areas of significant gold mineralization around our existing deposit are very encouraging for the expansion of the deposit. As we have seen from earlier results the potential of our currently defined resource appears to be unconstrained. In particular the new higher grade Savage Valley zone and its relationship to a hotter and potentially much larger system at depth are very intriguing and bode well for the district as a whole. As we have continued to see with the 2015 exploration program the North Bullfrog District is a large Nevada gold system that we believe has tremendous potential.”
Table 1
Drill Results from Savage, Rhyolite and North YellowJacket Targets
(Reported drill intercepts are not true widths. At this time, there is insufficient data with respect to the shape of the mineralization to calculate its true orientation in space.)
Savage Target
From (m)
To (m)
Length (m)*
Gold (g/t)
Silver (g/t)
NB-15-273
128.02
135.64
7.62
0.42
0.43
AZ 085 dip -60
144.78
175.26
30.48
0.39
0.83
205.74
217.93
12.19
0.12
1.00
236.22
281.94
45.72
0.19
1.54
286.51
368.81
82.3
0.40
10.68
including
358.14
361.19
3.05
2.05
178
377.95
384.05
6.1
0.13
0.80
hole ended in mineralization
NB-15-274
181.36
268.22
86.86
0.36
0.70
AZ 085 dip -50
339.85
377.95
38.1
0.26
0.57
hole ended in mineralization
NB-15-275
42.67
153.92
111.25
0.19
0.53
AZ 085 dip-50
175.26
202.69
27.43
0.21
0.86
265.18
289.56
24.38
0.17
0.49
298.7
307.85
9.15
0.15
0.33
312.42
327.66
15.24
0.15
0.36
350.52
379.48
28.96
0.13
1.22
Rhyolite Zone
From (m)
To (m)
Length (m)*
Gold (g/t)
Silver (g/t)
NB-15-266
80.77
204.22
123.45
0.34
3.68
including
100.58
102.1
1.52
1.06
11.0
including
169.16
175.26
6.1
1.87
9.62
AZ 090 dip -50
Hole ended in mineralization
NB-15-276
149.35
158.5
9.15
0.15
2.79
AZ 320 dip -55
208.79
216.41
7.62
0.19
1.69
236.22
242.32
6.1
0.19
0.87
North YellowJacket Extension
From (m)
To (m)
Length (m)*
Gold (g/t)
Silver (g/t)
NB-15-271
243.84
249.94
6.1
0.49
0.99
Azi 090 Incl -55
291.08
359.66
68.58
0.37
0.8
including
306.32
307.85
1.52
1.00
1.59
including
310.9
312.42
1.52
1.23
1.70
including
321.56
324.61
3.05
1.25
1.88
NB-15-272
121.92
123.44
1.52
0.24
13.0
AZ 085 dip -55
245.36
262.13
16.77
0.39
2.05
269.75
281.94
12.19
0.27
10.67
including
280.42
281.94
1.52
1.11
75.0
298.7
306.32
7.62
0.21
0.54
312.42
370.33
57.91
0.27
0.76
NB-15-277
No significant results
AZ 085 dip -55
NB-15-278
298.7
300.23
1.52
0.37
1.21
AZ 085 dip -55
316.99
320.04
3.05
0.22
0.80
329.18
335.28
6.1
0.15
0.34
* Mineralized thickness calculated @ 0.10 g/t Au cutoff with internal vein/stockwork intervals calculated @ 1.0 g/t Au cutoff
About the North Bullfrog Project, Nevada
Corvus controls 100% of its North Bullfrog Project, which covers approximately 72 km² in southern Nevada. The property package is made up of a number of private mineral leases of patented federal mining claims and 865 federal unpatented mining claims. The project has excellent infrastructure, being adjacent to a major highway and power corridor as well as a large water right.
The North Bullfrog project includes numerous prospective gold targets at various stages of exploration with four having NI 43-101 mineral resources (Sierra Blanca, Jolly Jane, Mayflower and YellowJacket). The project contains a measured mineral resource of 3.86 Mt at an average grade of 2.55 g/t gold and 19.70 g/t silver, containing 316.5k ounces of gold and 2,445k ounces of silver, an indicated mineral resource of 1.81 Mt at an average grade of 1.53 g/t gold, and 10.20 g/t silver, containing 89.1k ounces of gold and 593.6k ounces of silver and an inferred resource of 1.48 Mt at an average grade of 0.83 g/t gold and 4.26 g/t silver, containing 39.5k ounces of gold and 202.7k ounces of silver for oxide mill processing. The mineral resource for the mill process was defined by WhittleTM optimization using all cost and recovery data and a breakeven cut-off grade of 0.52 g/t gold. In addition, the project contains a measured mineral resource of 0.3 Mt at an average grade of 0.25 g/t gold and 2.76 g/t silver, containing 2.4k ounces of gold and 26.6k ounces of silver, an indicated mineral resource of 22.86 Mt at an average grade of 0.30 g/t gold and 0.43 g/t silver, containing 220.5k ounces of gold and 316.1k ounces of silver and an inferred mineral resource of 176.3 Mt at an average grade of 0.19 g/t gold and 0.67 g/t silver, containing 1,077.4k ounces of gold and 3,799.2k ounces of silver for oxide, heap leach processing. The mineral resource for heap leach processing was defined by WhittleTM optimization using all cost and recovery data and a breakeven cut-off grade of 0.15 g/t.
Qualified Person and Quality Control/Quality Assurance
Jeffrey A. Pontius (CPG 11044), a qualified person as defined by National Instrument 43-101, has supervised the preparation of the scientific and technical information that forms the basis for this news release and has approved the disclosure herein. Mr. Pontius is not independent of Corvus, as he is the CEO & President and holds common shares and incentive stock options.
Carl E. Brechtel, (Nevada PE 008744 and Registered Member 353000 of SME), a qualified person as defined by National Instrument 43-101, has coordinated execution of the work outlined in this news release and has approved the disclosure herein. Mr. Brechtel is not independent of Corvus, as he is the COO and holds common shares and incentive stock options.
The work program at North Bullfrog was designed and supervised by Mark Reischman, Corvus Gold’s Nevada Exploration Manager, who is responsible for all aspects of the work, including the quality control/quality assurance program. On-site personnel at the project log and track all samples prior to sealing and shipping. Quality control is monitored by the insertion of blind certified standard reference materials and blanks into each sample shipment. All resource sample shipments are sealed and shipped to ALS Chemex in Reno, Nevada, for preparation and then on to ALS Chemex in Reno, Nevada, or Vancouver, B.C., for assaying. ALS Chemex’s quality system complies with the requirements for the International Standards ISO 9001:2000 and ISO 17025:1999. Analytical accuracy and precision are monitored by the analysis of reagent blanks, reference material and replicate samples. Finally, representative blind duplicate samples are forwarded to ALS Chemex and an ISO compliant third party laboratory for additional quality control.
For additional information on the North Bullfrog project, including information relating to exploration, data verification and the mineral resource estimates, see “Technical Report and Preliminary Economic Assessment for Combined Mill and Heap Leach Processing at the North Bullfrog Project, Bullfrog Mining District, NYE County, Nevada” dated June 16, 2015, which is available under Corvus Gold’s SEDAR profile at http://www.sedar.com.
About Corvus Gold Inc.
Corvus Gold Inc. is a North American gold exploration and development company, focused on its near-term gold-silver mining project at North Bullfrog, Nevada. In addition the Company controls a number of other North American exploration properties representing a spectrum of gold, silver and copper projects. Corvus is committed to building shareholder value through new discoveries and the expansion of those discoveries to maximize share price leverage in a recovering gold and silver market.
On behalf of
Corvus Gold Inc.
(signed) Jeffrey A. Pontius
Jeffrey A. Pontius,
Chief Executive Officer
Sorry if table does not post well!
I never know if a table will post well or not in advance……Sorry.
One of these days I’ll figure it out!
Why Do I have an interest Professor? I like it long term. Good cash position today and commitments to invest more in the future if it is needed. JEff and the team know what they are doing and North Bullfrog appears to have good potential.
I definitely will be purchasing approximately three business days from now.
Oil peaked at 1:30 near 32.40 and started a downtrend. It just fell to 30.40 now and may head to below 30 again as the oil producing countries may just be talking like before and not taking any action. I sold all my oil positions on the very strong rally.
Silver broke out yesterday on a closing basis (dotted blue line). It made for a noisy chart but I included a bunch of Fibonacci based support/resistance levels. Yellow=levels based on closing prices. You can see that silver has broken out of both Fib fans.
Silver looks like it is moving finally. What do you think of the wedge chart Cory posted from Peter Brandt today?
Whether we’ve seen the final low or not, I think silver will break out of the wedge to the upside.
Here it is based on weekly closes:
Thanks Matthew. Out of curiousity…..I have a TA question for you.
I know some technicians will draw the support line using the opening/closing prices on the candles , and other times they use the intra-day highs or for the bottom line they use the intra-day lows. Do you have a preference, as I feel they can both be valid?
For example, Peter’s chart is using the intra-day highs, and this moves the trend-line up a bit:
http://www.kereport.com/wp-content/uploads/Peter-Brandt-silver.png
I use both and have found that the intraday highs and lows tend to be better on the lesser charts – day and especially hour and minute. If you’re looking at years of price history, not days, weeks, or months, then using weekly or monthly closes can be very effective. Taking action based on weekly closes can get you in or out ahead of the herd and/or reduce your false signals.
In a way, a weekly chart really isn’t a weekly chart if you use the absolute highs and lows. The same goes for a monthly or even daily chart. Line charts obviously consist of nothing but closing prices. If you spend any time using them for your TA, you’ll see that which one you choose, a daily, weekly, or monthly, will make all the difference in the way your chart turns out. Each usually yields a completely different looking result. For example, a perfect H&S pattern on a daily chart often completely disappears on a monthly or even weekly chart. And of course, trend lines often change substantially because a high or low daily chart close that happens Monday thru Thursday can be very different than the Friday close that the weekly uses and those Friday closes can be very different than the end of month closes that the monthly uses.
Look at this monthly line chart. Notice that on a closing basis, gold never took out the 50% retracement level and that that level is $45 lower than it is when using the absolute highs and lows.
I would feel pretty good about a weekly close outside the wedge in my chart.
It’s a long way up (about 25%) but silver needs to join gold above its 600 week moving averages (simple and exponential.
Thanks for asking that question, Ex, and answering it, Matthew.
This same point has been bugging me for MONTHS.
<Taking action based on weekly closes can get you in or out ahead of the herd and/or reduce your false signals.<
Nice !
Thanks for the Q&A…….M&E…………..C&CF
Great response Matthew, and thanks for the insights. That makes sense to use the intraday highs/lows on the lesser charts (day, hour, minute), and use the closing prices for trend lines on the weekly and monthly. Yes, good point about the line charts only use the closing numbers. You touched upon an important topic about how seemingly important patterns that appear on the smaller charts are often unnoticeable when the Friday close or monthly close is registered on the longer range charts. Good stuff man. Much appreciated!
Apple came with decent numbers but showing weakness. I don’t see how long they can keep tweaking the cell phones. There is so much competition and great phones being produced in China and South Korea. I sold my Apple near 123 as I think there is a 65 to $75 price possible. When they were near 800 before the splits, I had predicted 380 based on the charts and it came down just below that. Some Apple fans I know were laughing at my forecast back then.
Of Mike earlier, Doc was very positive on silver.
I thought that was really an interesting release, Paul L
Doc, do you sell any gold stock positions if they rise significantly in the short term, or are you only accumulating on dips, waiting for a longer term trend change? Thanks, Doc.