6 Charts showing strength in gold for the fall
Here is a bullish technical outlook for gold. While I do not agree with the author’s conclusions on a couple of these charts the way he is seeing them are flat out bullish for this fall.
Click here to visit the original posting page.
…
6 Charts Indicate Fall Strength for Gold
GOLD! Public opinion is divided on it. Some swear by it and some swear at it. Americans were allowed to get involved in it again in 1974 but probably did not get in closer to the 1980 top. What is a difficult decision to buy at $100 all of a sudden becomes an easy decision at $800. The power of the crowd!
Gold has had a good run so far this year, but it looks like the precious metal and the mining stocks are both poised for some fall strength, especially if the U.S. dollar can weaken. Only a very small number of Real Money readers have emailed since January about gold, so I believe the public is not involved. Interest in gold could increase if it reaches $1,400 in the next few weeks.
Here are some charts that support our thinking.
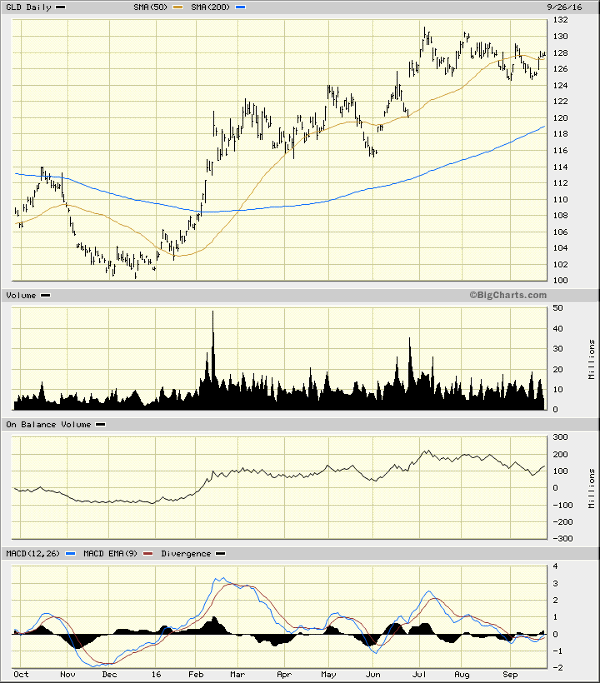
In this 12-month daily chart of the SPDR Gold Trust (GLD) , above, we can see GLD making a small bullish continuation pattern (a flag or pennant) as prices hold above the 50-day moving average line. The 200-day average is moving up strongly. The On-Balance-Volume (OBV) line started to improve in the past week and helps support the advance. The Moving Average Convergence Divergence (MACD) oscillator generated a cover-shorts buy signal and could soon cross above the zero line for an outright go-long signal.
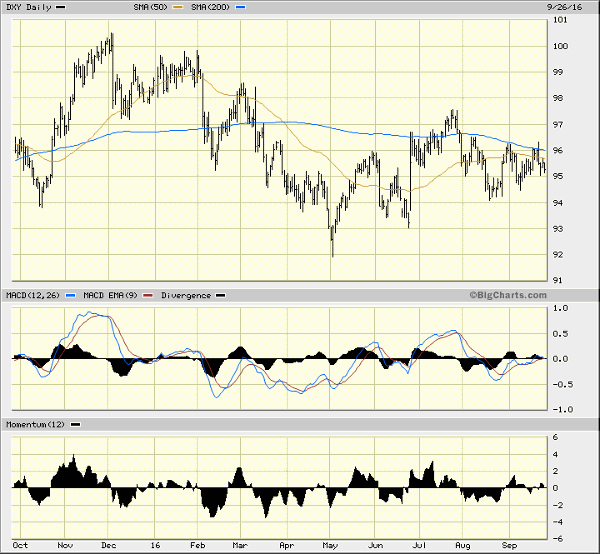
Traders who are involved in precious metals will closely track the currency market. A weaker dollar can put a bid in for gold and silver. The price of the DXY, the dollar index, looks like it has formed an equilateral triangle the past two months. A weakening MACD oscillator and a bearish divergence between the price action in August and September and the momentum study could be just enough to tip prices lower in the next couple of weeks.
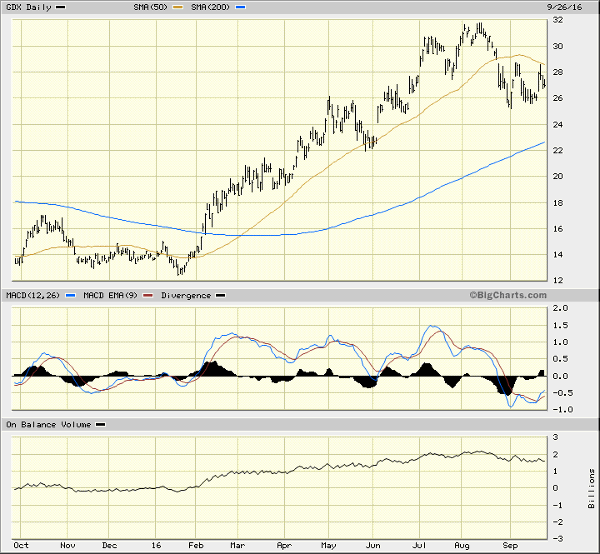
In this daily chart of the VanEck Vectors Gold Miners ETF (GDX) , above, we can see a small equilateral triangle formation developing since late August. The MACD oscillator has signaled a cover-shorts buy signal while the OBV line has only declined slightly the past two months as prices declined about 18%.
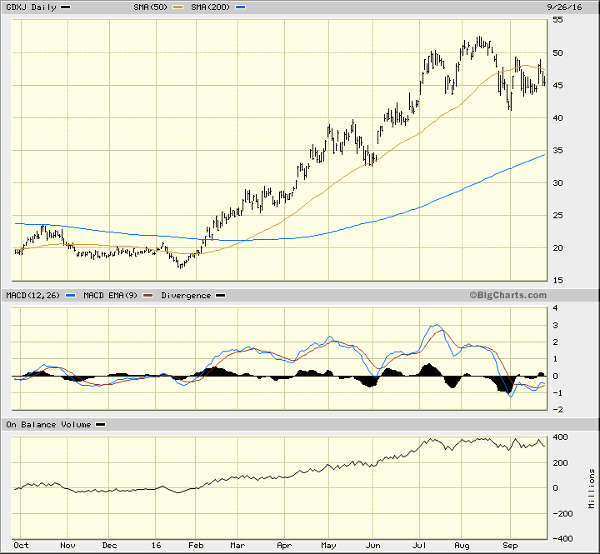
In this daily chart of VanEck Vectors Junior Gold Miners ETF (GDXJ) , above, we see a bullish-looking triangle formation that in subtle ways is more bullish than the GDX pattern. In September, the GDXJ makes higher lows while the GDX makes equal lows. Also, the OBV line on this chart of GDXJ hardly dips at all.
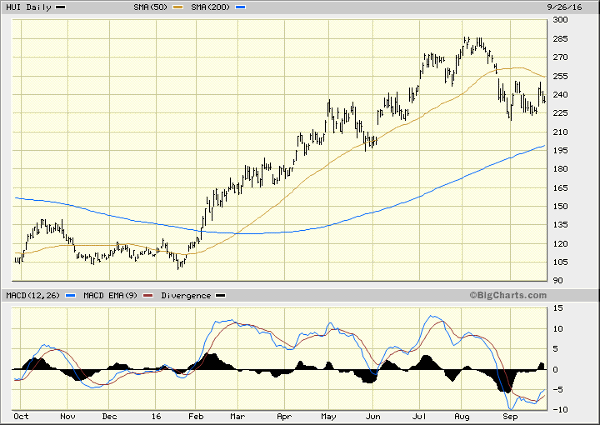
Some gold followers like to keep track of the HUI, the NYSE Arca Gold BUGS Index, and this chart is also poised to move higher with the cover-shorts buy signal from the MACD oscillator.
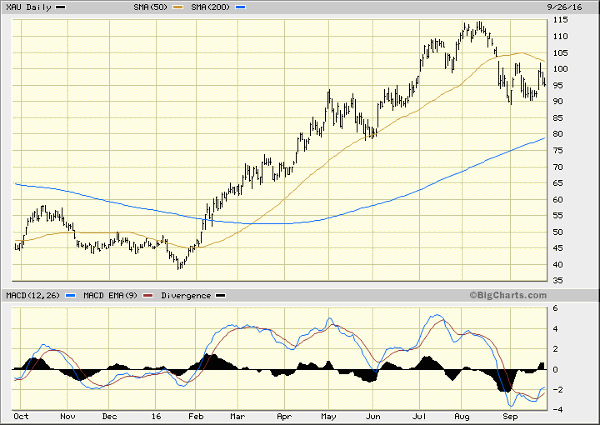
The PHLX Gold/Silver Index (XAU) also displays a bullish setup in this chart.
What did he say?
Can you post a link.
THX
It will be on this tomorrojaytaylormedia
Click podcasts
I have been waiting for the broadcast recording to post, but it has not yet.
Jay was in Portugal with his wife, and I don’t know if he is back and up to speed posting yet!
Sorry I couldn’t post a link immediately.
Great news for Globex Mining…
BRIEF-Globex – Nyrstar to reopen mid-Tennessee mines
Sept 27 (Reuters) –
* Globex Mining – Globex Royalty Stream will restart with
production Nyrstar to reopen mid-Tennessee mines
* Globex Mining – Nyrstar stated that they expect “Ore
production to commence during Q1 2017 and mill processing
operations to commence in Q2 2017”
Here’s the actual press releas:
http://globexmining.com/staging/admin/news_pdfs/9-27-16%20Nyrstar%20to%20reopen.pdf
And here’s an excerpt from a 2014 press release when zinc was trading at the same price it is now:
“Other highlights: The price of zinc has been rising steadily, recently reaching U.S. $1.04 per pound. This is
good news for Globex as our zinc royalty on Nyrstar’s Mid‐Tennessee Mine is tied to the zinc price. This
rise in price results in improved monthly royalty payments to Globex. At the current zinc price, monthly
payments should be in the range of $85,000 to $90,000.”
Here’s that 2014 release:
That $1 million+ is meaningful to a company with a market cap of $11.5M (C$15M). That figure will rise if the zinc price does (and I expect it to).
*That’s $1M+ per year.
Nice. Thanks for the heads up on Nystar. I was wondering if they’d reopen that mine now that Zinc prices are coming back.
I’ve been a buyer lately including today.
Demand for talc is growing and Globex has made significant progress on their large Timmins Talc-Magnesite Deposit since publishing the PEA. Keep that in mind if you take a look:
http://globexmining.com/staging/admin/news_pdfs/3-2-12%20TTM%20PEA%20final.pdf
I think both gold and silver are going to get their stochastics into oversold territory on the weekly chart before we see the low on this correction. Just a hunch.
At the start of the silver bull back in 2003, it took more than a year for the stochastics to return to oversold.
http://stockcharts.com/h-sc/ui?s=%24SILVER&p=W&st=2000-06-11&en=2008-04-09&id=p92881540506
After the start of the gold bull, gold’s stochastics took well over a year to return to oversold.
http://stockcharts.com/h-sc/ui?s=%24GOLD&p=W&st=2000-06-11&en=2008-04-09&id=p67832345559
I hear what you are saying, but on the weekly charts, gold and silver typically only get well into overbought territory no more than 2 times before the stochastics come back down to oversold levels. Generally speaking of course.
The fact that we are already neutral on the weekly chart doesn’t bode well at all for a sustained run from here. If the stochastics were to miraculously turn back up, I only think it would lead to a marginal new high in gold and silver before a large correction.
I am still all in, so it doesn’t really matter to me how this pans out. Would rather just get the lows over with sooner rather than later, but it may not necessarily be as healthy to do it that way.
BTW that 30 WMA looks like a nice target for the near term in $gold. Over the next 1-2 weeks a move to that level would likely be enough to send the stochastics into oversold territory.
I actually posted those charts to show that the odds look favorable to your view. Having said that, the silver chart looks particularly good to me so I still doubt that it will get there even if gold does. My guess is that neither will until sometime around the end of Q1 or early Q2 next year. However, I can’t score my confidence about that any higher than 60%.
The following comment is 9 months old but still true:
On January 10, 2016 at 1:42 pm,
Matthew says:
Gold is worth more CRB today than it was at $1923/oz in September, 2011. The price of gold in dollars says a lot more about the dollar than it does about gold! Only lone wolves and a few feral sheep seem to understand this.
Look at that monthly MACD:
http://stockcharts.com/h-sc/ui?s=%24GOLD%3A%24CRB&p=M&st=1999-09-08&en=today&id=p27669693651&a=422676478
(Update: Gold is getting ready to underperform commodities for a long time.)
What do you consider a long time? (I can’t see that monthly chart.)
Do you think we have hit the secular peak?
In this case, I considers years a long time.
Here’s a weekly chart but the MACD looks nothing like the monthly MACD (of course).
http://stockcharts.com/h-sc/ui?s=%24GOLD%3A%24CRB&p=W&yr=16&mn=7&dy=0&id=p43444369052&a=437502275
It is tempting to call a secular peak here but I have to call it a cyclical one for now since I think gold will fly again in a few years (in real terms).
My slow iPad and the small box Big Al provides!
Jaytaylormedia.com
Is the link, then click podcasts and look for 9/27 broadcast
Spanky, I do not use technical analysis, but mathematics based on price and volume.
Just for the heck of it, I ran a calculation, based on both daily and weekly numbers, and the odds of RSI for the continuous price of gold going below 30% are de minimis.
(Both less than 10%)
Stochastics are different than RSI. Also, depends on what parameters. I am talking weekly chart, default setting for Full Stochastics on Stockcharts.com.
I agree with both of you. The odds are slim for the RSI but not slim at all for the stochastics.
But I don’t have a program to compute overbought or oversold except RSI.
It is interesting that gold is comfortably above the widely followed 200 week MA but has struggled for weeks at the 233 week MA:
http://stockcharts.com/h-sc/ui?s=%24GOLD&p=W&yr=5&mn=3&dy=22&id=p36957751844

CEO of Nulegacy On Jay Taylor’s show right now.