

Contributed by Rohit Goel
Crude Oil prices have been on a wild ride over the last couple of years, dropping from $100+ in late-2014 to $26 in early-2016, then miraculously doubling over the next few months. As the Energy Information Administration (EIA) explains, there are several factors influencing oil markets, such as production, economic growth, geopolitical and economic events, supply disruptions, speculator and money manager positioning etc. In addition, US Dollar also has a significant inverse relationship to oil prices.
However, the major reason for oil’s plunge since late-2014 was Saudi Arabia blocking an OPEC output cut in November 2014, with the intent of pushing oil prices lower, inflicting serious pain on the US shale oil industry (which needs high oil prices to break even) and increasing their own market share – so essentially, increased supply. The best gauge of how this increased supply has caused an imbalance in the global oil market is the EIA inventory report, which is released every Wednesday morning and has a big impact on oil prices. So let’s compare the price of WTI with the EIA inventory, starting in Jan 2013 when the market was in a steady state and remained so for the next year and a half (the period highlighted in yellow denotes the peak summer driving season – more on this later):
(Note from Tim: there appeared at this point a very large table, which I’m going to leave out, since the information is expressed in graph form anyway).
Now let’s plot the WTI price against the cumulative inventory change:
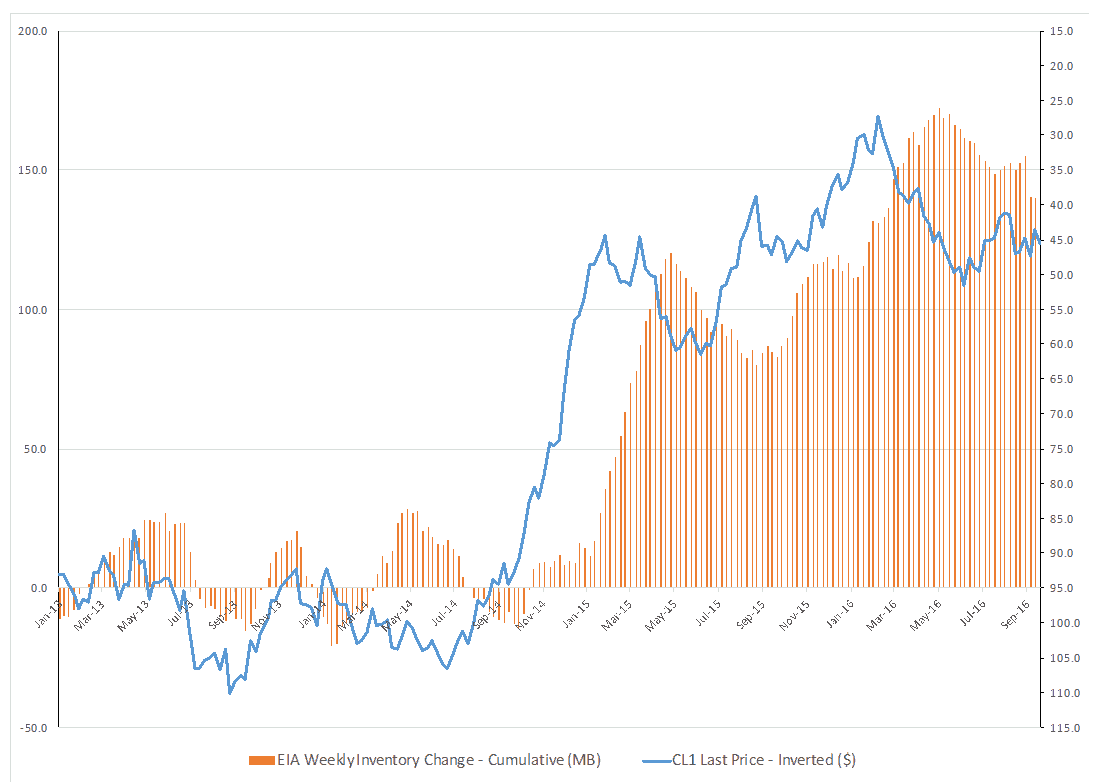
This chart reveals something very interesting – since the OPEC meeting in late-2014, WTI prices seem to almost perfectly track cumulative inventory numbers 12 weeks in the future. This can be explained by the fact that the crude oil market is a futures market, hence it anticipates and prices forward and not current inventory balances.
Here’s the same chart with the cumulative inventory numbers moved back 12 weeks:
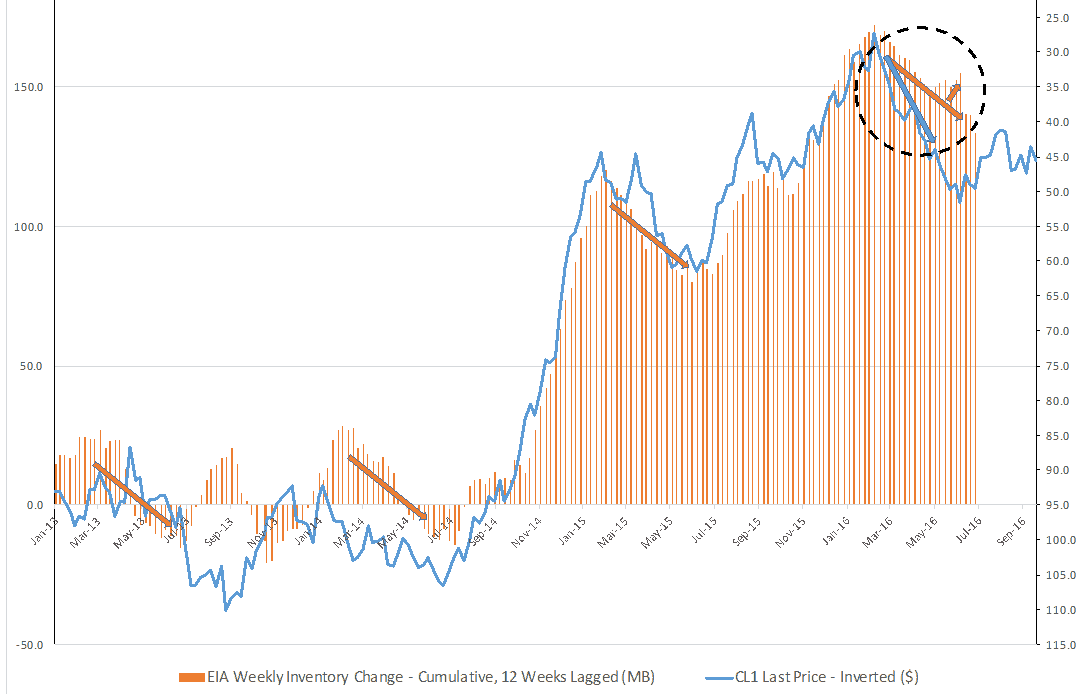
The chart confirms the strong relationship between the two. It uncovers another peculiar development as well. In the top right corner, note the divergence starting this February, when WTI rallied much faster than the pace of decline in the (lagged) inventory, and continued rallying in April when the (lagged) inventory actually started growing again. Here’s what probably happened:
• Due to the summer driving season hitting top gear, (lagged) inventory has dropped from February to July in all of the four recent years (downward-sloping orange arrows), causing WTI prices to move higher and hit the high of the year in June/July of 2014, 2015 and 2016 (so far). This year, unlike the previous three years, the (lagged) inventory actually started increasing in May (upward-sloping orange arrow), and the subsequent reduction was only because of massive drawdowns caused by heavy storms in the Gulf of Mexico (remember that the last three cumulative inventory numbers in this chart correspond to the September 2016 inventory reports).
• The uncharacteristic strength of WTI’s rally from this February can be partially attributed to swirling rumors of a production freeze leading up to the Doha summit in April, causing WTI to anticipate lower inventory levels going forward. The failure of the summit and the yawning gap between price and inventory should have caused a sharp correction in prices, but constant jawboning from OPEC and other producers desperate for higher oil prices (Russia, Venezuela et. al.), natural disasters (wildfires near Canadian oil sands, tropical storm Hermine in the Gulf of Mexico), terrorist attacks (in Iraq and Nigeria) etc. have prevented that from happening.
To project what likely comes next, let’s consider the following:
• Oil price volatility has been high leading up to this week’s much-hyped meeting of oil producers in Algeria, that had earlier raised hopes for a tangible agreement to freeze/cut production. Desperate Saudi Arabia has offered to cut production by 0.5 MBpd, but Iran has shown no interest in curbing its output at current levels. While odds of a deal are virtually nil, till the meeting ends, oil prices will be pulled hard in both directions by a barrage of headlines.
• Even a production freeze would do absolutely nothing to address the global glut, as the major oil producers are already pumping at all-time highs and close to their maximum production capacities. Russia’s crude oil production, that averaged 10.7 MBpd in 2015, is expected to average 10.9 MBpd in 2016. Saudi Arabia pumped a record 10.7 MBpd in August, an increase of 0.5 MBpd from the beginning of the year. Iran has been feverishly raising its output, and is expected to hit 4 MBpd by year-end from the current 3.6 MBpd.
• Higher prices are motivating US shale oil producers to come back online. The number of active oil rigs has risen to a seven-month high of 418. Production in the U.S. has recently leveled off at 8.5 MBpd, after nearly 18 months of declines.
• Per this report from OilPrice, Libya has recently increased production by 0.2 MBpd to 0.5 MBpd and is hoping to hit 1 MBpd by the end of the year. Nigeria, following a peace deal with Niger Delta Avengers, has brought back 0.2 MBpd to the market and could continue increasing supply.
• The demand side of the equation doesn’t look good either. EIA’s latest oil market report sharply downgraded its 2016 demand growth forecast to 1.3 MBpd and only 1.2 MBpd for 2017. This is consistent with anemic 2016 GDP forecasts for the US (1.8%) & Eurozone (1.5%), and Japan barely growing at 0.5%. Recent pillars of strength, China and India are also wobbling.
• China and India used low oil prices earlier in the year to top up their Strategic Petroleum Reserves. This temporary demand boost is going to fade fast.
• The cumulative inventory change in the post-summer period (September to December) for the last three years was: 2013 – build of 7.4 MB, 2014 – build of 25.9 MB, 2015 – build of 32.0 MB. Considering this trend, and incorporating the supply/demand factors above, it wouldn’t be surprising at all if inventory reports start showing massive builds going forward. However, one wildcard that could pollute this analysis is inventory on water. In the past, floating storage was much more expensive than storage on land. However, due to record low freight rates today (yet another symptom of the poor health of the global economy), floating storage rates are a lot closer to on-shore tank rates. The floating storage market is quite opaque as no government agency collects data on it. So there is considerable incentive to store surplus inventory on water, thereby artificially reducing EIA inventory numbers.
• Away from the oil market, last week the Federal Reserve punted on a rate hike, but made it abundantly clear that a hike is coming soon. That, combined with BOJ’s and ECB’s perennial efforts to devalue their currencies, should provide firm support to the US Dollar.
• Looking further into the future, the increasing affordability of electric vehicles could erase about 2 MBpd of demand by 2023. Given that the global surplus in crude oil over the past two years was only a little more than 2 MBpd at its worst point, oil bulls hoping for a return to $100+ oil in a few years might be in for a huge disappointment.
Putting it all together, the supply/demand imbalance and the headwinds posed by the US Dollar paint a very bleak picture for oil prices. And unlike US equities, commodity prices cannot stay disconnected from fundamentals for very long. WTI tried to correct in late July/early August, but strategically-timed OPEC production freeze rumors aborted the correction and caused a substantial rally (yet again!) – prices haven’t strayed too far from $45 since then.
As we head into the Fall maintenance period, the divergence between WTI prices and cumulative inventories should reverse, and a retest of the recent low of $39 is on the cards. If support at $39 (which is the 50% Fibonacci retracement level of this year’s entire $26 low to $52 high move) breaks, expect fast money to pile into the short side and WTI to drop to mid-$30s in a hurry.
Mickey Fulp:
https://m.youtube.com/watch?v=KBJcFwrqj3Y