
A technical outlook for gold and specific gold stocks

I have featured Robert Alexander (or Alex as he goes by) from Chart Freak a couple times on this blog because when I look at his technical outlook I often agree. The post below is a succinct breakdown of the precious metals charts as well as specific company charts. Overall the charts are pointing bullish to him and with the break today looks to be the needed follow through.
Click here to visit the ChartFreak.com website.
Here’s the post…
What have the readers at Chartfreak been looking at as the best near term investment? Since the lows were put in in December, we have been buying and focused on Miners. I did expect a pause or pullback in January, but I also wrote a special report telling my readers “Not to get too cute” and over trade this sector, because more upside was on the horizon. On the blog, last week I wrote specifically about GDX, see post: https://chartfreak.com/2017/01/market-vectors-gold-miners-gdx/
I’ve decided to give you a portion of the member report sent before Fed Wednesday. The report covered all of the markets, but the main focus has been on the Precious Metals sector. So the following is a part of Wednesday’s precious metals section.
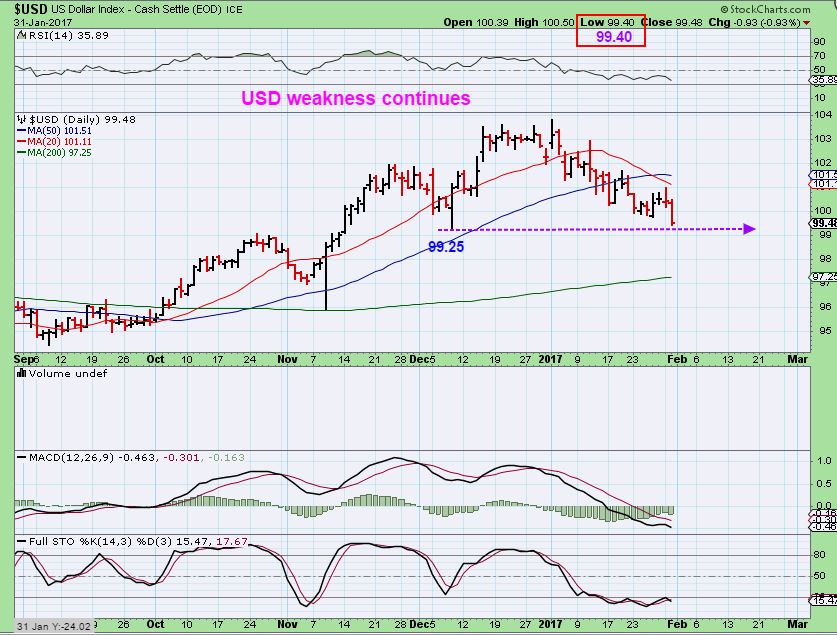
USD – The dollar continues to weaken, it is close to breaking the last dcl. That would be a failed daily cycle.
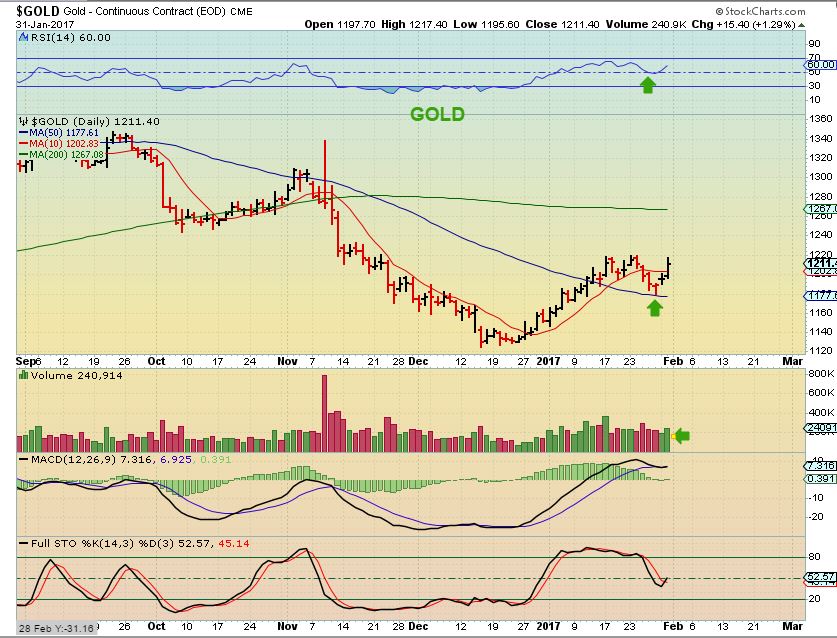
GOLD, SILVER, & MINERS
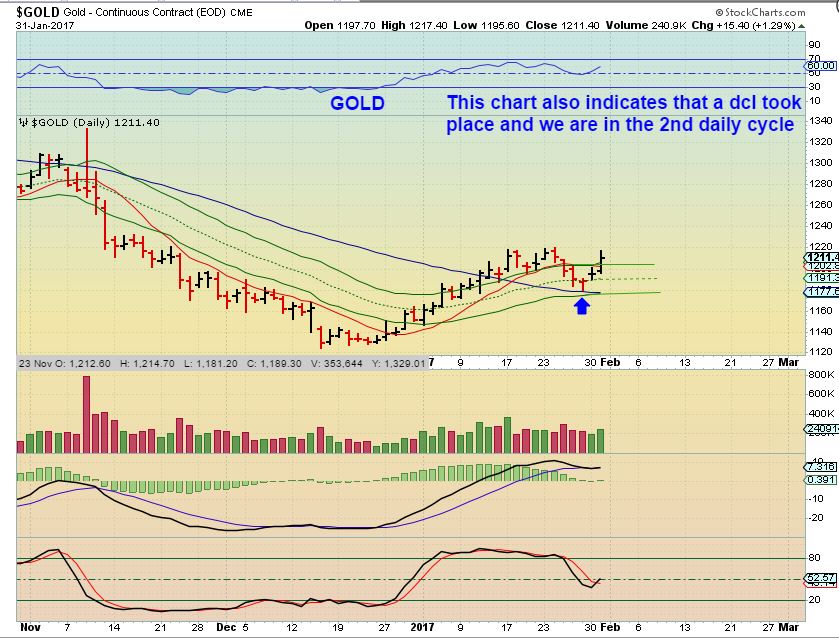
GOLD – This move looks real,and we saw follow through after a test of the 50sma. It also regained the 10sma.
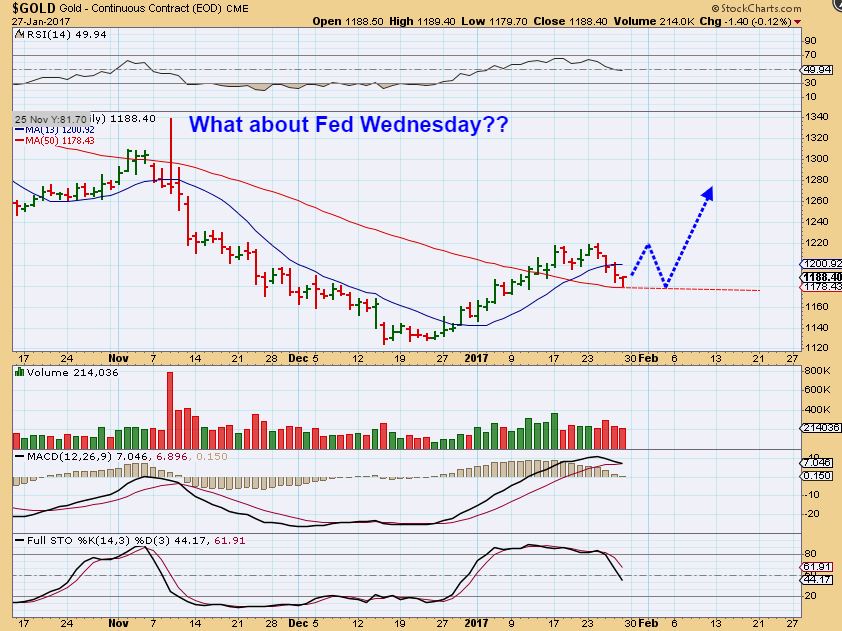
JAN 27th – Last week one of my Gold scenarios showed exactly what we are seeing in Gold right now, with that bounce off of the 50sma. I showed the possibility of a small post Fed drop. HOWEVER…
GOLD – ICHI CLOUDS with a special setting. I have found them to be quite reliable. This ICHI cloud indicates that we had a dcl on the 27th ( Daily Cycle low) and now we have started a new daily cycle. It says that GOLD is Bullish.
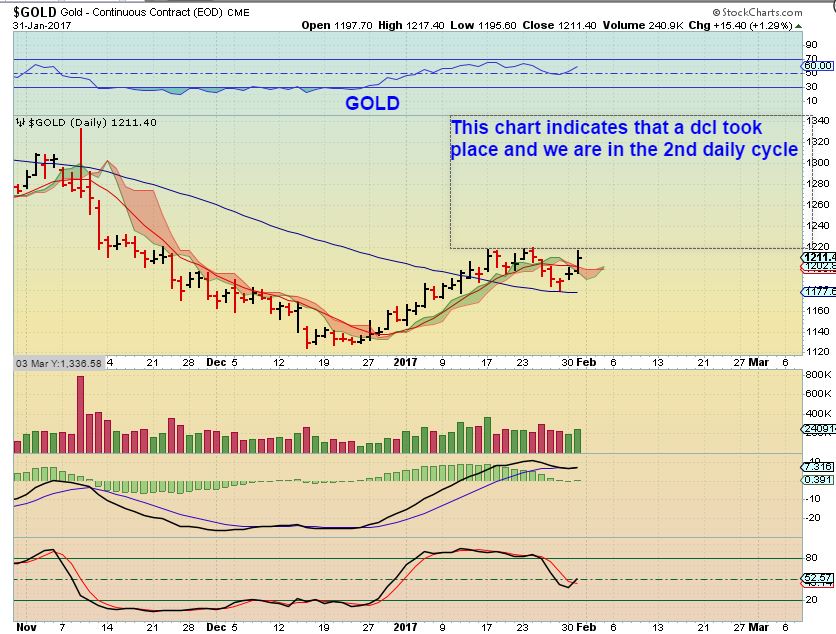
The Timing bands also indicate that we have broken down to a dcl on the 27th and started another daily cycle. This says that GOLD is bullish too.
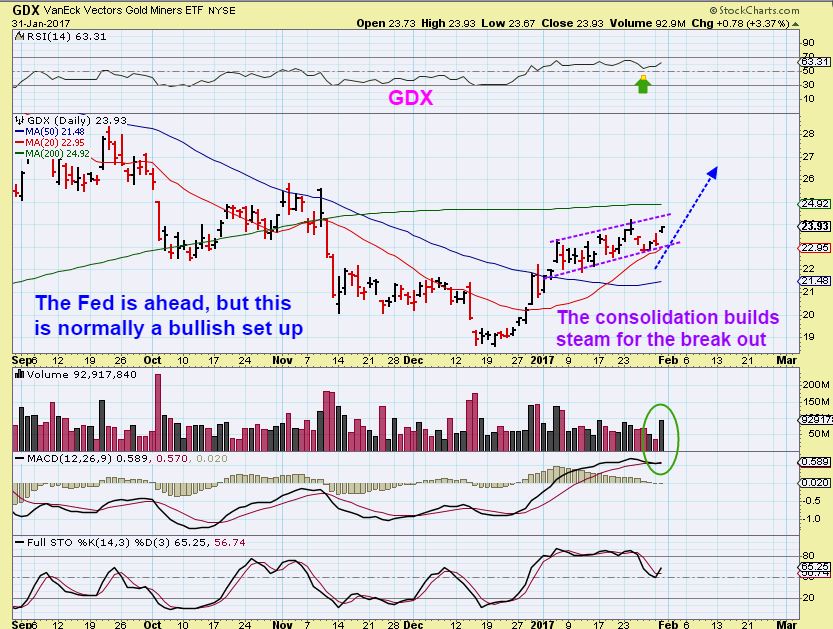
GDX – This looks like a bullish rising consolidation that builds up energy for a break above resistance.
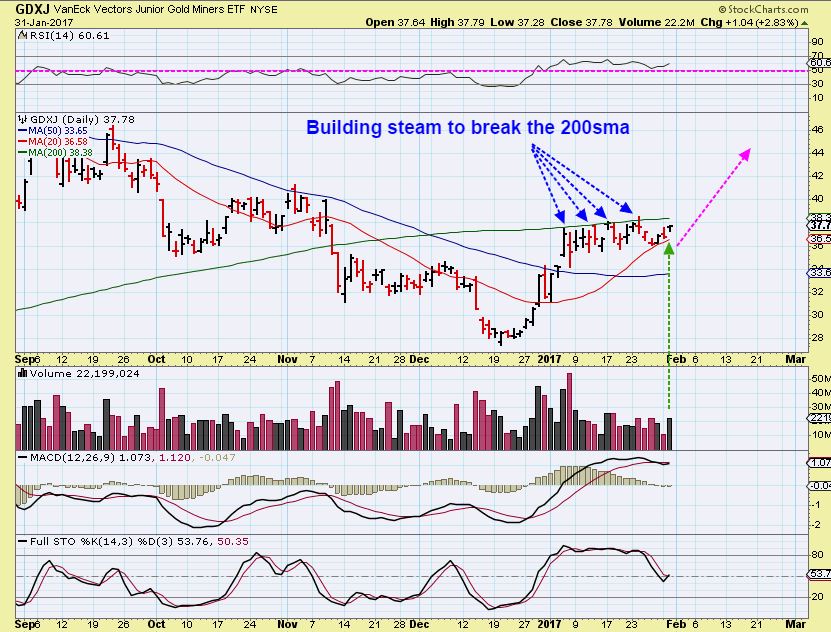
GDXJ – This is the same as GDX, but GDXJ is pushing bullishly against the 200sma. It wants to break out sooner than later.
The FED Decision is ahead of us, but as seen above, Gold , Silver, and Miners charts are bullish.
SO let’s take a look at some individual miners. Are some leaders acting bullishly?
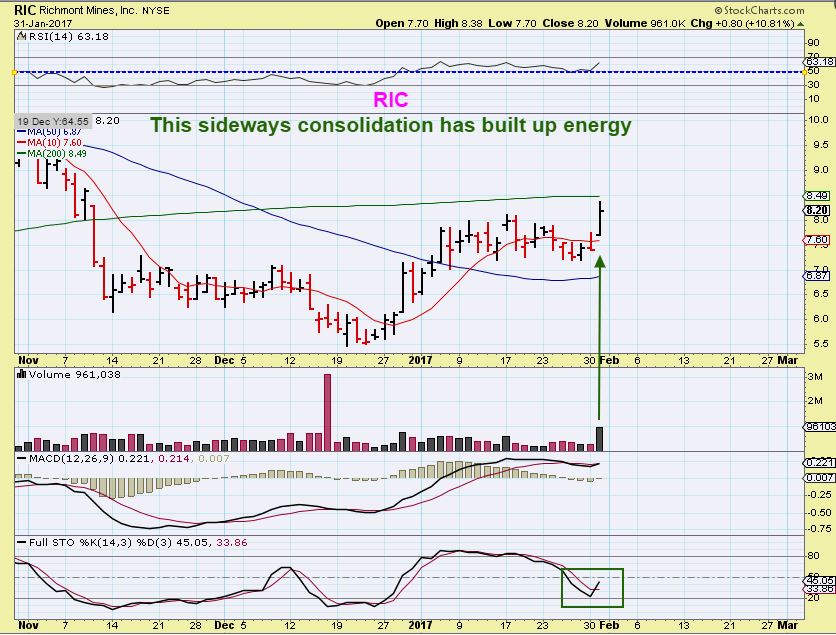
RIC – Ric made a 10% move Tuesday and looks set to break out above the 200sma.
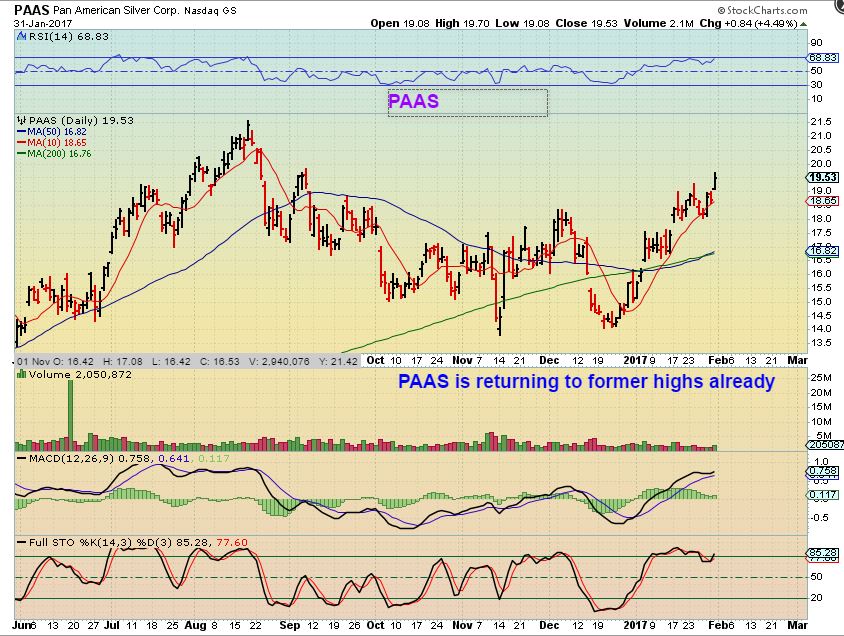
PAAS – This one is well ahead of the pack.
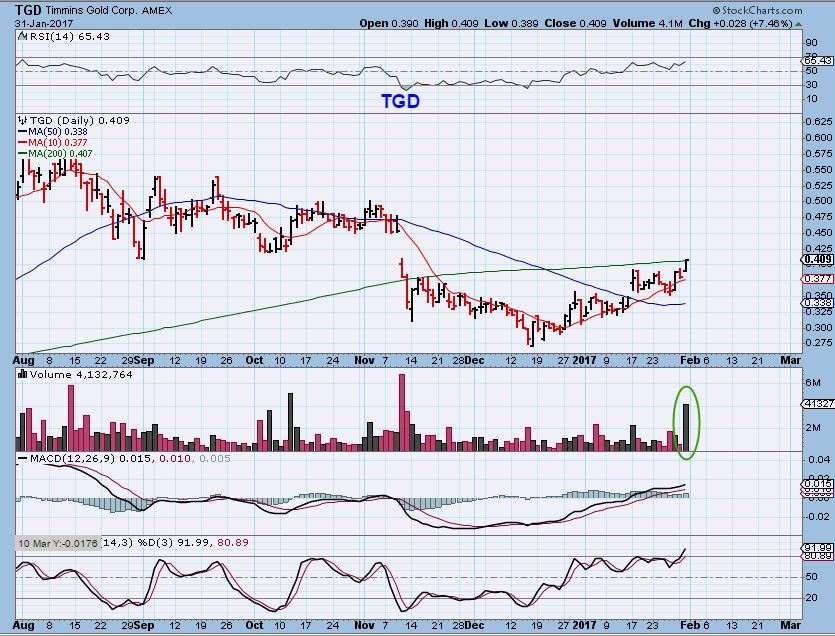
TGD – TGD is pushing against the 200sma and had a nice surge in volume Tuesday too.
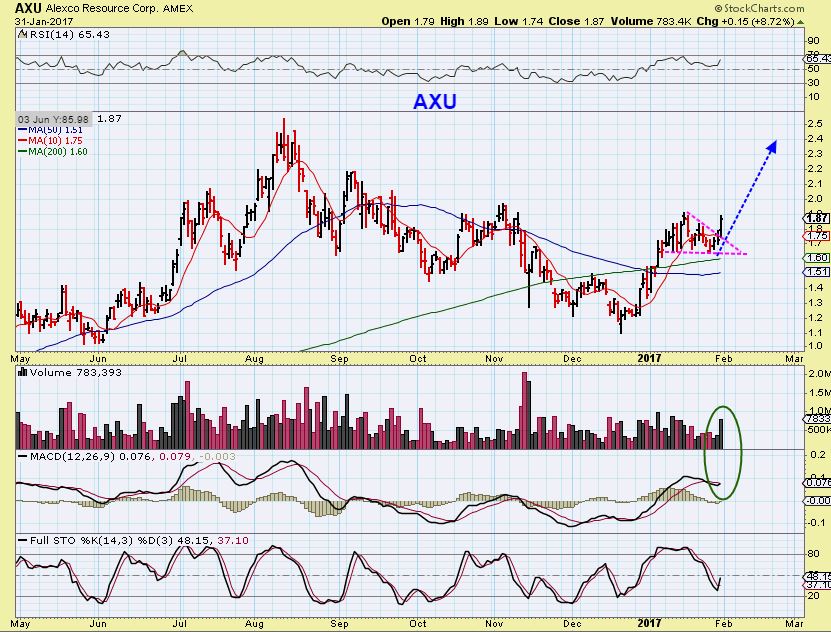
AXU – Breaking out, this is a buy ( or add to your position from Dec lows if you didnt on the break of the 50sma).
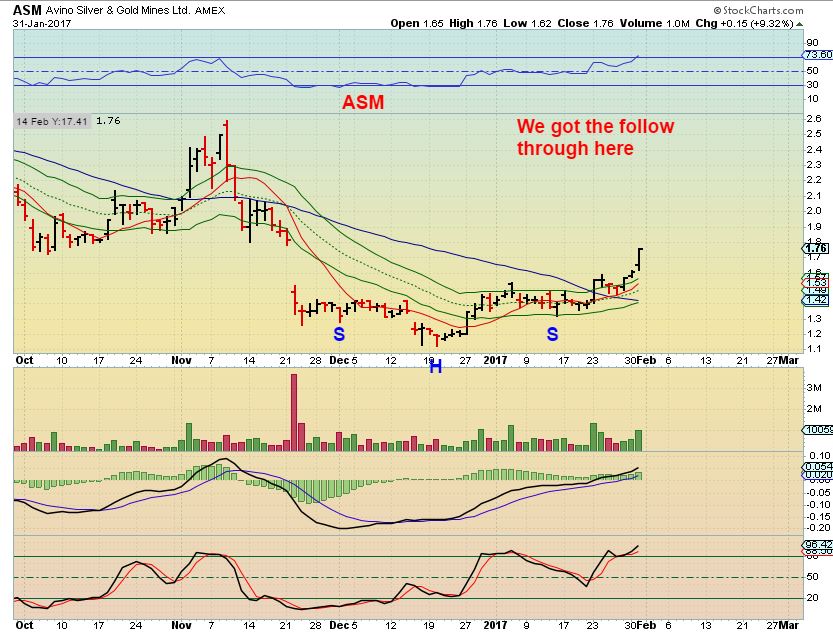
ASM – They had released earnings and gave a favorable 2017 outlook too. It was back testing that break out here on Jan 26th.
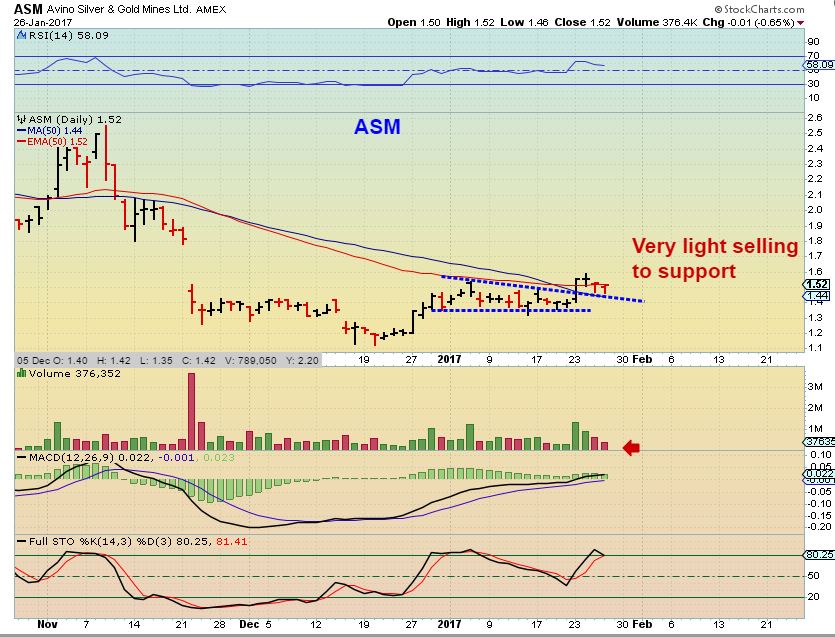
ASM – Follow through over the last 3 days and up over 9% Tuesday.
I wanted to point out some JUNIORS that I have always had on my watch-list, but I never discuss them because the volume is low. AT times some of these were only trading 20,000 in volume per day, but they have been recovering very well. This could indicate what other miners will do soon.
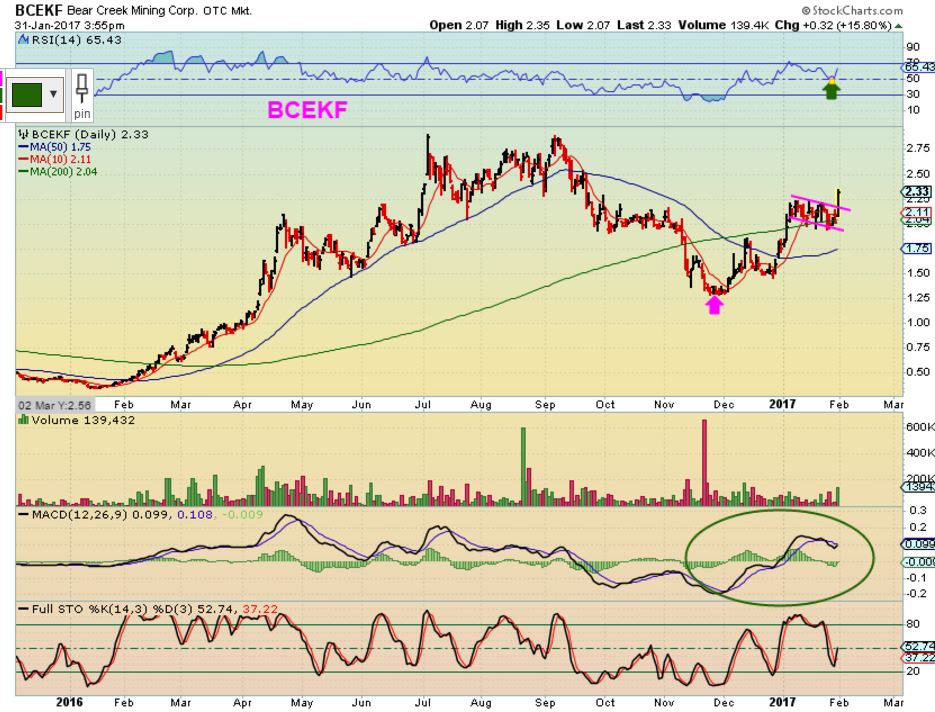
BCEKF – up 16% Tuesday, almost back to summer highs.
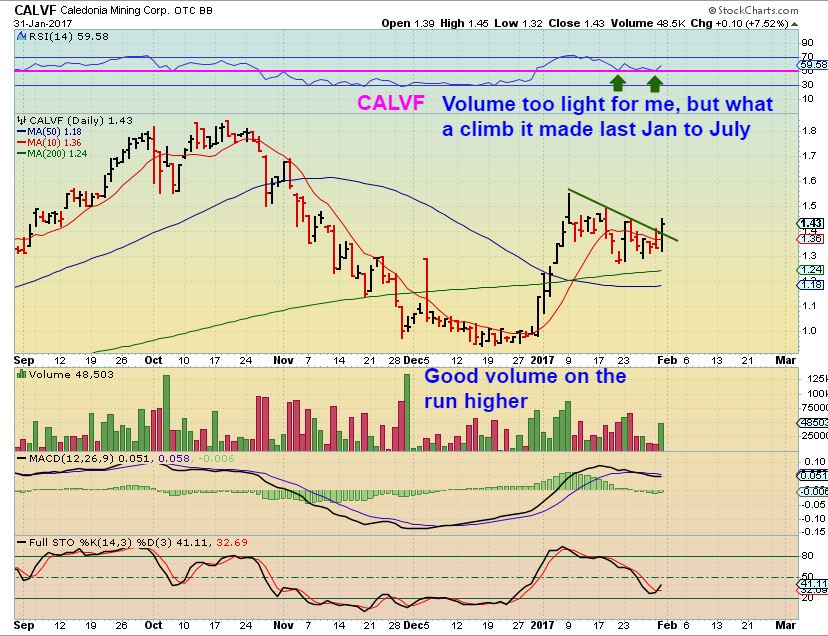
CALVF – This one is an old favorite, but it still lacks sufficient volume for me to trade it. What a nice run it made in 2016 though ( see a 1 year chart).
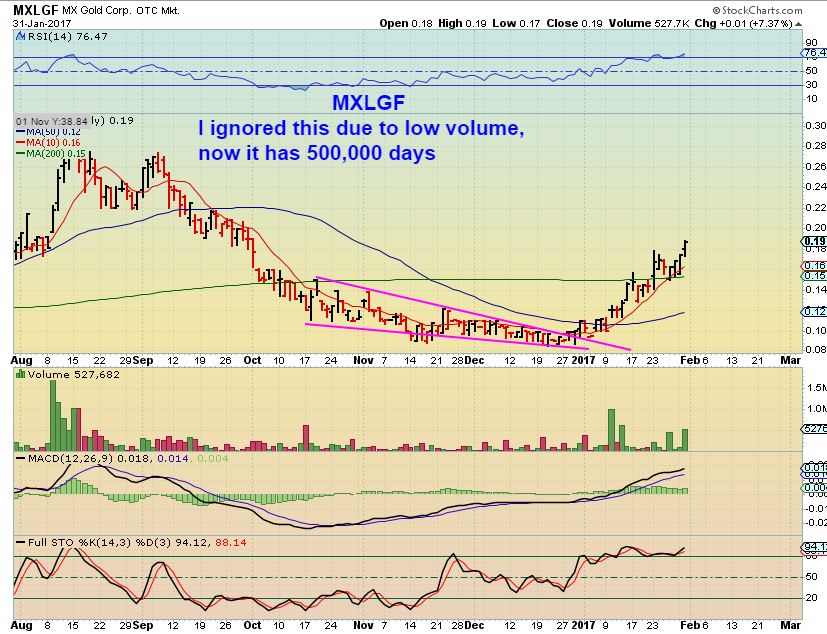
MXLGF – This one hurts, because I like the company. I almost bought it and recommended it here in December when it broke from the Base and wedge. Again, Volume was WAY TOO LIGHT. There were days when it only traded 10,000 shares. At 10 cents a share, $1000.00 was all that was traded in a day? I cant buy that, but off it went. Now it occasionally puts out 500,000 in volume, like Tuesday, and has doubled. I might be looking into it when the average volume is over 300,000.
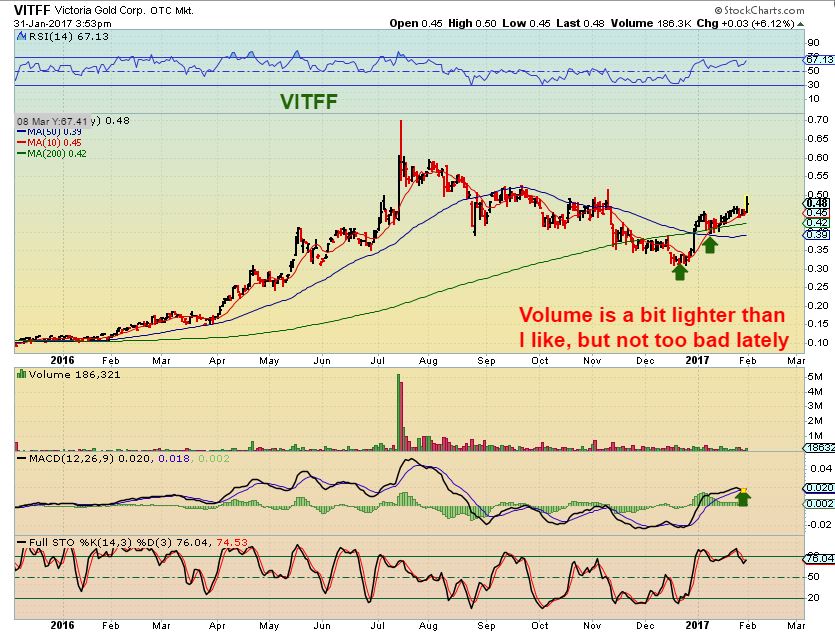
VITFF – ANN mentioned this one Tuesday, it was not on my list. It looks good. It has broken the down trend, consolidated, and is also moving higher.
So in conclusion: It is a Fed Wednesday and by now, you know how this goes. There can be a crazy reaction following that 2 p.m. decision (Volatility). Let’s just see what we get, because this is a bullish looking sector. The charts for Gold, Silver, and Miners are set up bullishly as shown. We should be still riding Miners from the DEC lows (Not getting too cute and selling everything), so we have a little wiggle room if Miners get a little shaky post Fed.
.
~ALEX
.
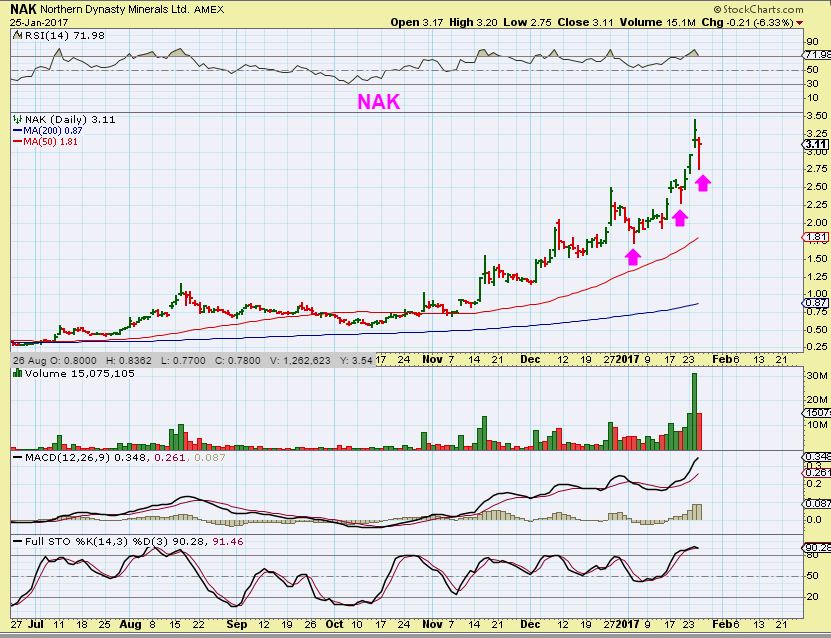
FEB 2 – So that was a good part of Wednesdays report, and we were ready for the Bullish set up in Miners. There are other set ups mentioned in todays report, and I even repeatedly discuss how some consolidations now forming in the junior Miners ( consolidations like NAK shown below) can be very bullish over time.
NAK – See August to October. Why were we still in this piece of garbage? They make no money and this stock is going nowhere!
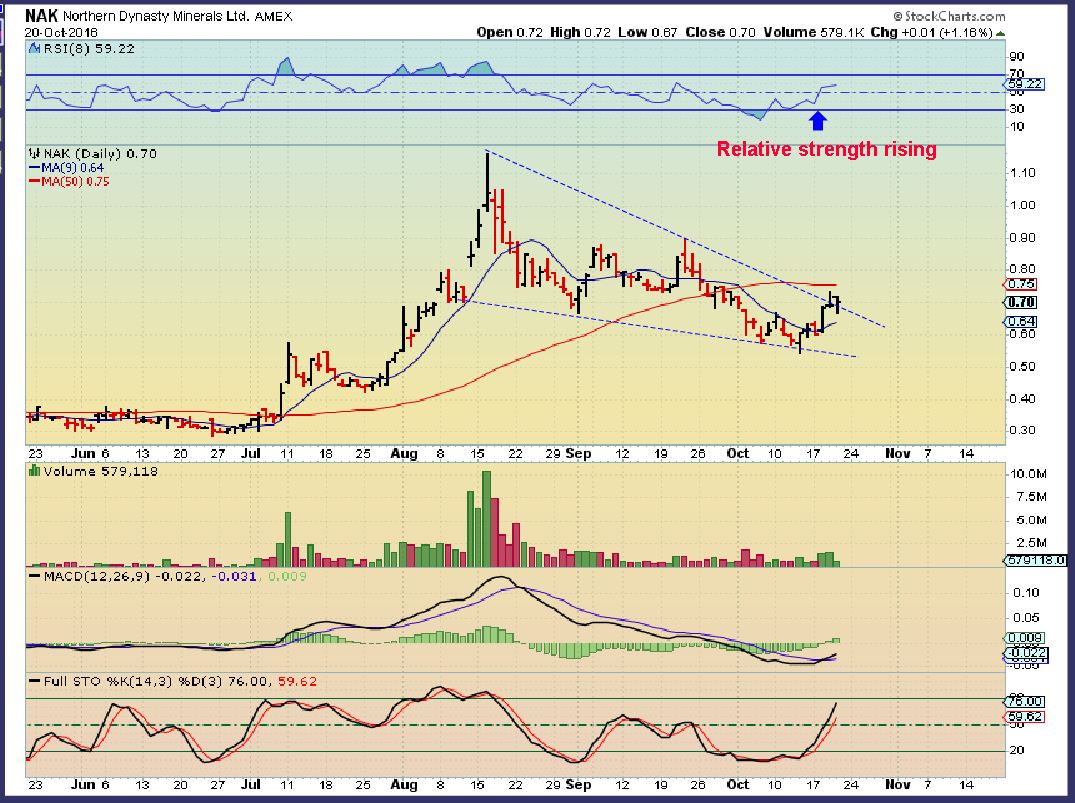
See AUGUST to OCTOBER- that is a consolidation period. Consolidations can be very rewarding when they finally break higher, and we caught this entire move!
If you think this type of report can help you to stay focused and add to your trading style, why not sign up for a Month or quarter and give us a try. I usually write 4 reports mid-week with 10 – 15 charts, followed by a large weekend report, usually with 30 plus charts. Thanks for being here in the the public section of Chartfreak!
~ALEX
Meanwhile, while you weren’t looking, Israel removed an illegal jewish group of about 40 families were removed from Palestinian property that they had bought.
I notice chartists are right until they are not, others are wrong until they are right.
Everything looks rosey for gold.
I wonder how some excellent chart people see a sideways to down move in Feb with charts like these.
The charts made it very clear that we are in a new cyclical bull market early last year. While most people very seriously doubted the new bull, this chartist did not. I also never doubted its return while many were sure that gold had entered a secular bear and would stay down for decades and/or go below $1,000. The charts made it very clear way before the 2015 low that the gold miners were in for a fantastic new bull market – and I always said so. Most people sold under great stress when they should have been buying.
Here’s a small excerpt from one of my email replies to Glennfidish six days shy of a year ago.
Feb. 8, 2016
“IPT jumped 103% today and is up 48% right now. This type of action causes most people to sell way too much because they don’t grasp how rational the move really is at this time. In the context of the new bull market, it remains dirt cheap.”
(Those who agreed (or believed me) saw their IPT shares go up another 500% in just a few months.)
No matter the approach, absolutely no one is always right, but the charts have been extremely valuable to me.
Maybe “those that agreed” with you bought ipt, but anyone that was in the market following ipt for years knew it was cheaper than dirt @ 11 cents.
As were so many other PM shares.(recall me saying just buy the kitco list?)
I guess I could say anyone “that agreed with me” made money on lots of shares. lol
A person far from needed charts to recognize just how cheap shares were.
If charts help ya Mathew, use ’em.
They seem to help alot of people.
Notice that I said it was dirt cheap “in the context of the new bull market.” The charts made it clear that silver was going much higher and that is what made .11 cheap. Had silver gone much lower as many were expecting it to, then .11 would have been expensive.
The problem that the value-oriented speculator in me has with most chartists is that they are always looking for lower prices when major lows arrive. Almost all of them have a hard time spotting a turn until the market has risen substantially. Their rules don’t allow for it.
I gotta agree, spotting a change in direction can be elusive.
There are many ways to play the markets tho, simply buying cheap (what no one wants) as doc is saying about uranium today,(I believe him) and waiting till it is wanted to sell is one way.
Rogers,Faber seem to do ok with the method.
Others, myself for example, dont trust the markets or brokers (or banks for that matter) so remove any gains pretty quickly, I dont leave something for months or years.
I consider the risk too high.
Even today, my broker had “technical difficulties” attempted hacks is what it is, last month was multiple times.
b-
You are spot on about chartists….phoooey! Gold is real value in a fiat ponzi scheme….YOU ABSOLUTELY CANNOT print your currency RECKLESSLY and expect positive results…..nope CANT happen…let history be your guide…end…of……..story….:))
Marc, fwiw, when you asked me almost two years ago if you should keep Spanish Mountain Gold, it was the monthly chart that led me to conclude that you should not sell.
It was 2.5 or 3 cents (CDN) at the time and hit 22 cents last August.
yes saw that
THE ONLY REASON this has taken so long…is SIMPLY because in the course of history NO CURRENCY has ever been so GLOBALLY and MASSIVELY entrenched like the US DOLLAR…..it took the world 70 years to wake up..lol!!
Lovely charts and analysis. NAK seems like a lottery ticket, but good luck to all who own it.
(The Independent is not as high a quality source as the Telegraph.)
I think I read Bob M saying he doesnt use charts, just momentum?
Rogers and Faber have said they are lousy market timers.
I think I have been using momentum for years without realizing it.
Altho, a person can watch a live gold chart and see where gold will go up or down depending, but I find I dont really want to be glued to a screen that much.
Thats probly a form of charting.
SKI Gold Stocks Trading System Current Prognosis – Dr. Jeffrey M. Kern
Jordan Roy-Byrne CMT, MFTA – 02/02/2017
https://thedailygold.com/ski-gold-stocks-trading-system-current-prognosis-2/
Good interview with Dr. Kern. The SKI system using USERX as a gold stock proxy has been quite effective in issuing reliable buy and sell signals. I don’t own it, but USERX has some interesting holdings and is fairly aggressive for a large gold stock fund.
The chart for Northern Dynasty is a perfect example of what a chart looks like when a stock that has been relentlessly pumped by too many newsletters and shysters has ended it’s run and the guys who did the pumping are now getting out. Insiders are selling.
Interest rate futures are still saying the consensus is that there will be two rate hikes this year.
My momentum work says that gold may run out of a bit of steam this weekend.
The future short-term trajectory may depend on Trump actions, more than central banks, but the longer term still appears upwards.