Treasuries could be leading the USD

I love it when people find charts that are highly correlated. Especially when one of those charts is ahead of the other (also known as leading). The post below from Market Anthropology presents the similarities between treasuries (TLT) and the US dollar.
The charts speak for themselves but let us know what you guys think. Are we in for a significant drop in the dollar?
Click here to visit the original posting page…
The $’s April Showers Can Bring May Flowers to Gold
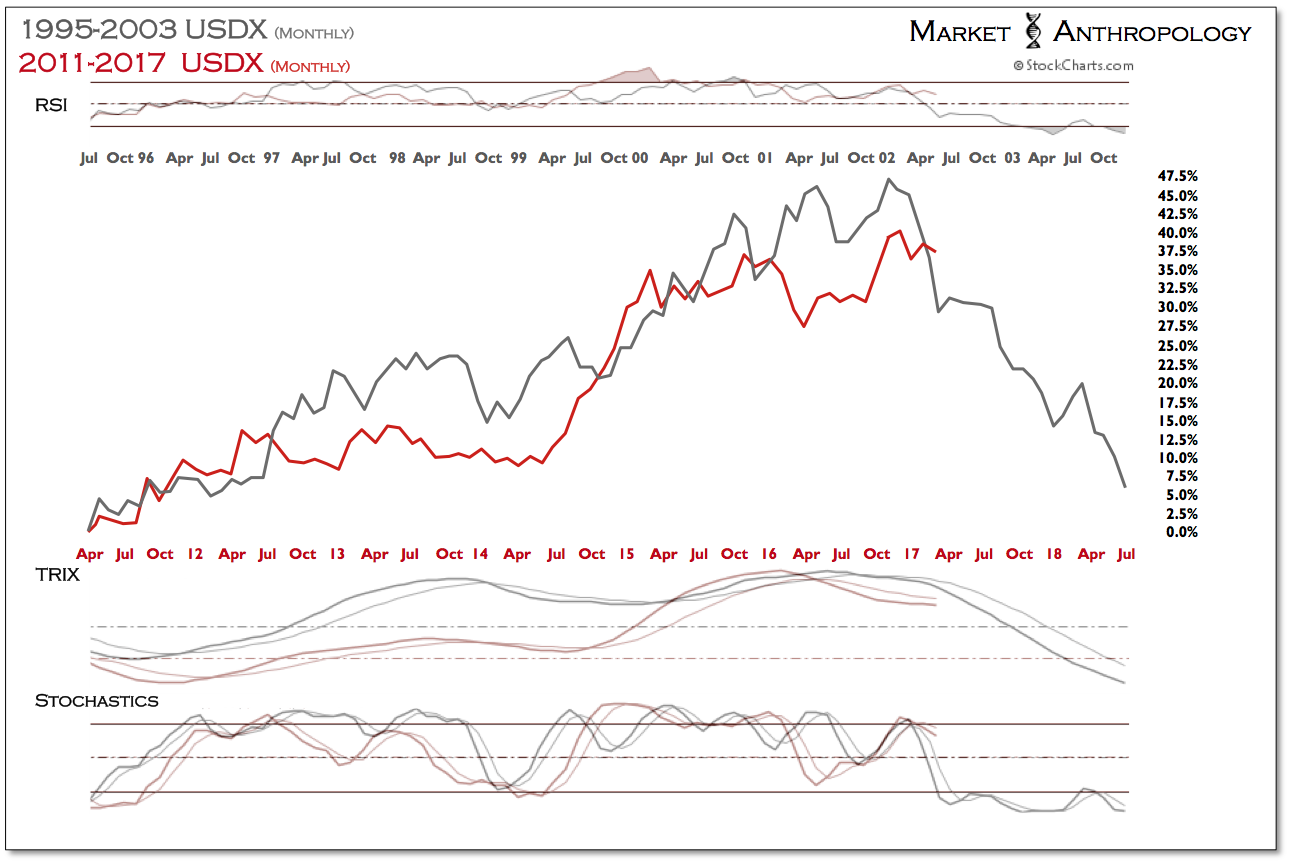
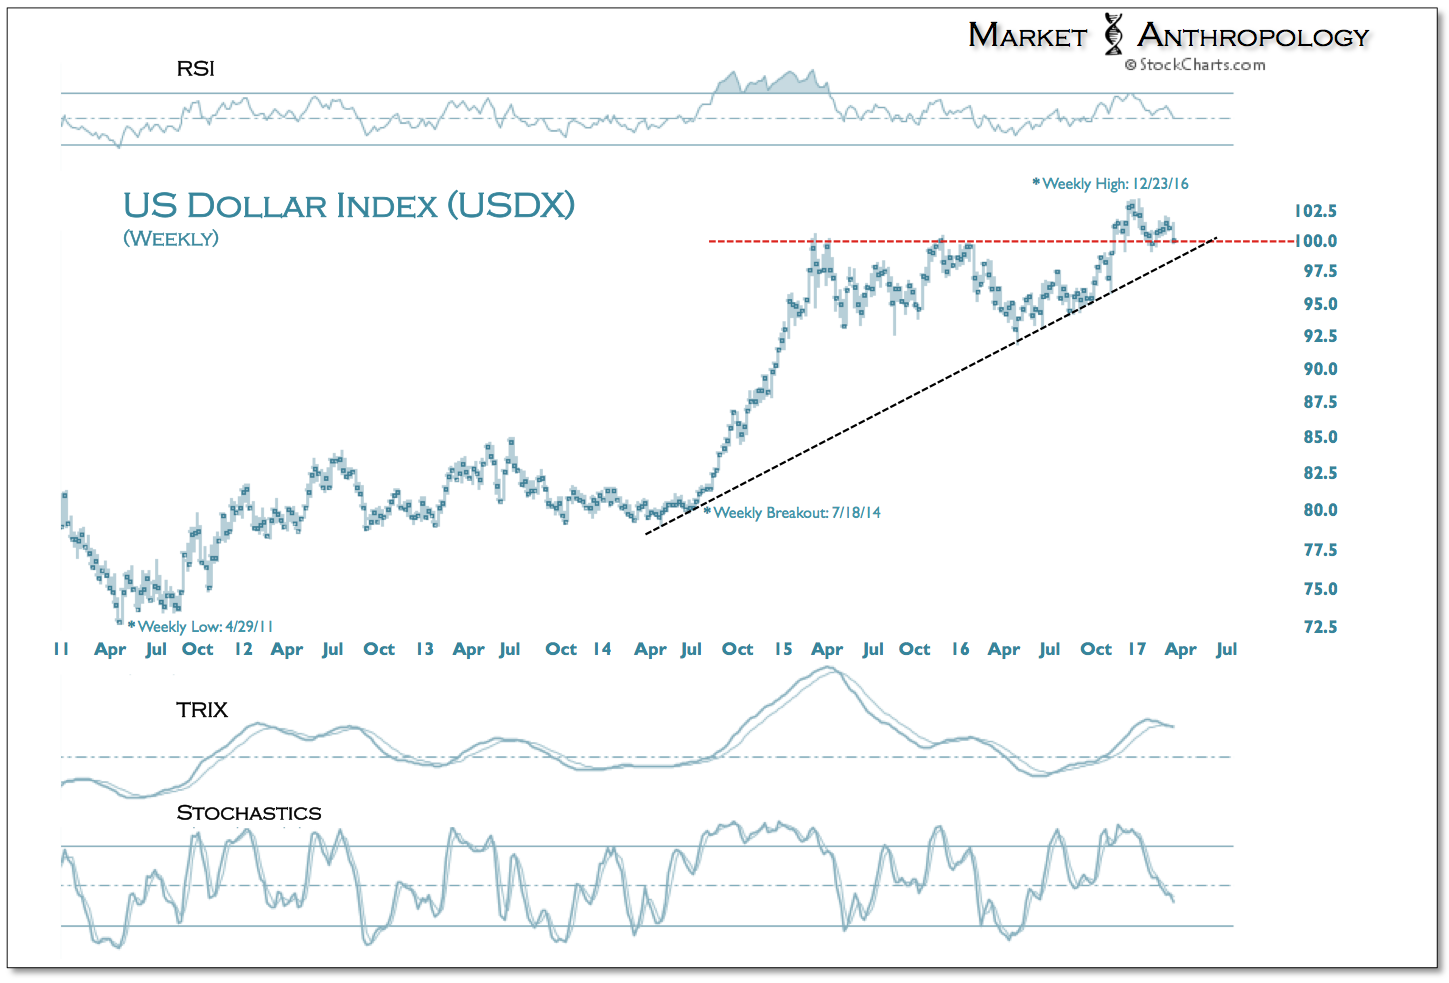
Regardless of how hawkish the Fed frames possible future rate hikes this year, we suspect a cyclical breakdown in the US dollar index to unfold. Moreover, by our estimates of the leading market breakdown in US Treasuries last November, the window for a dollar break appears to be now open and extended through April.
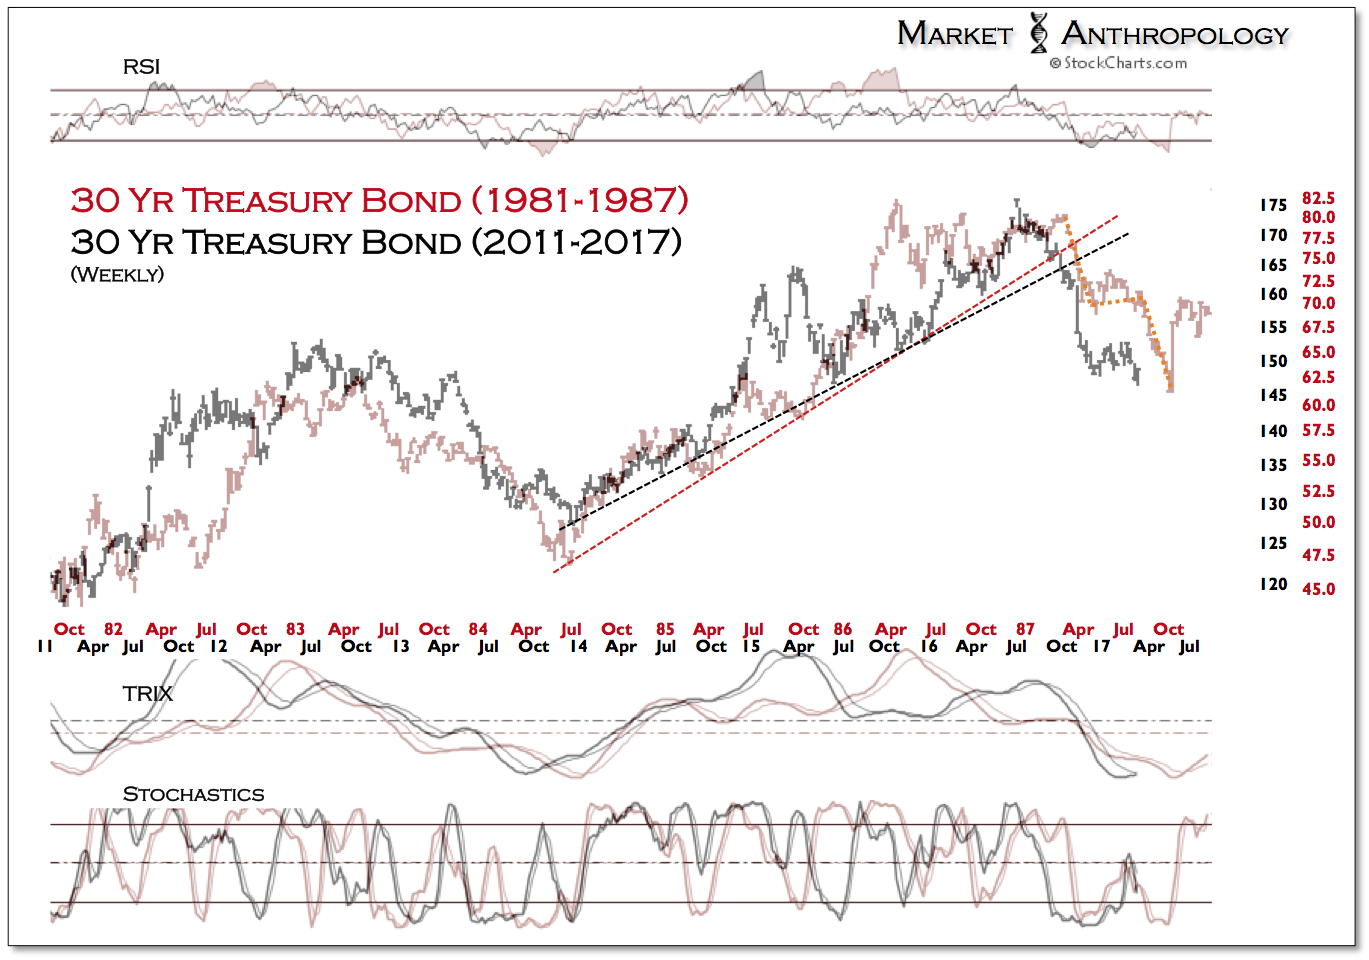
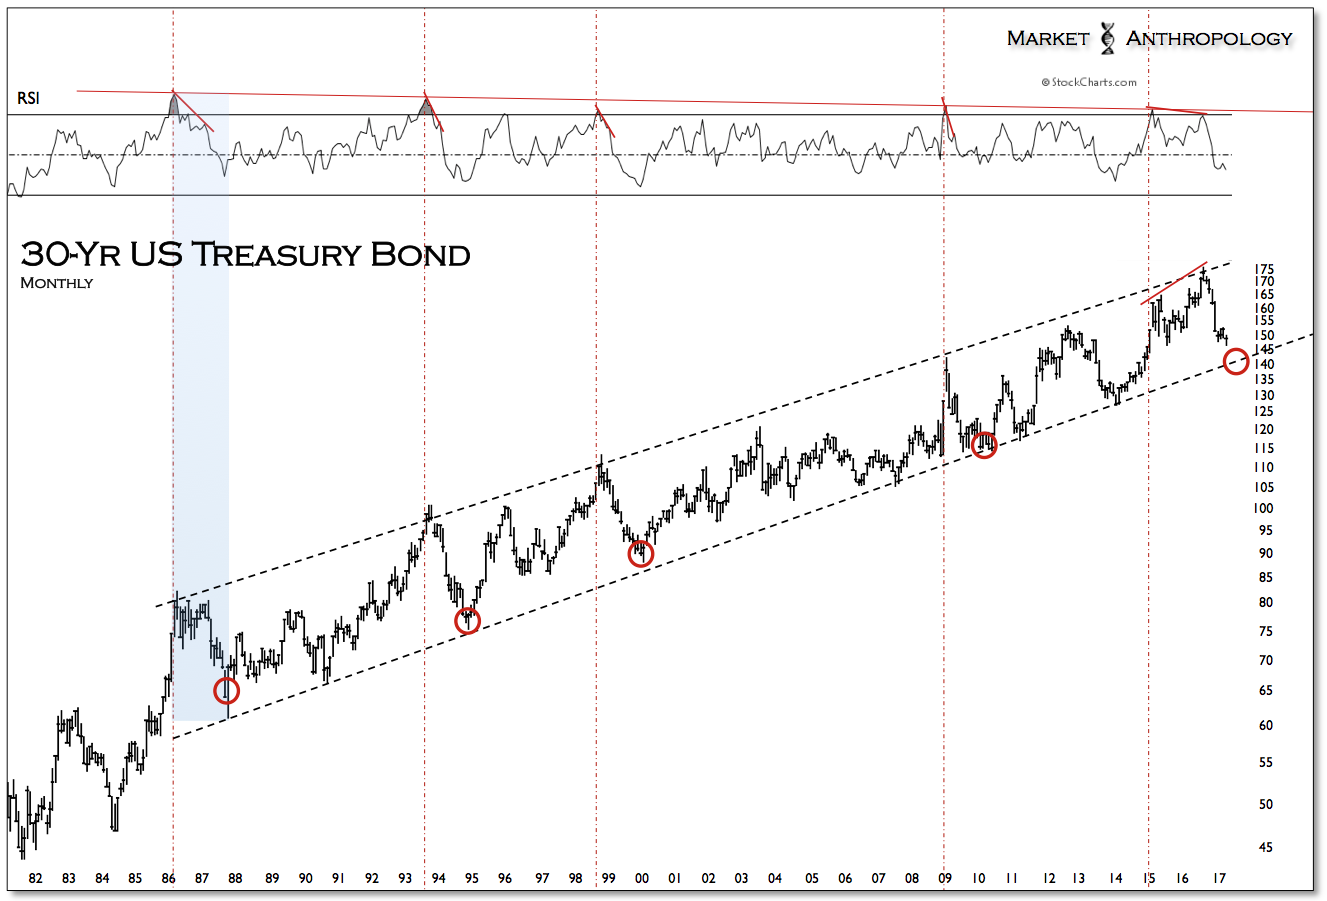
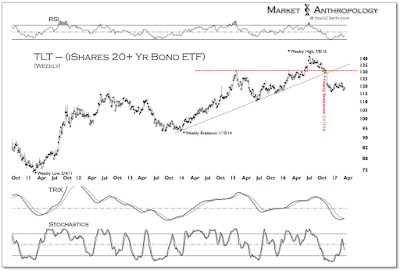
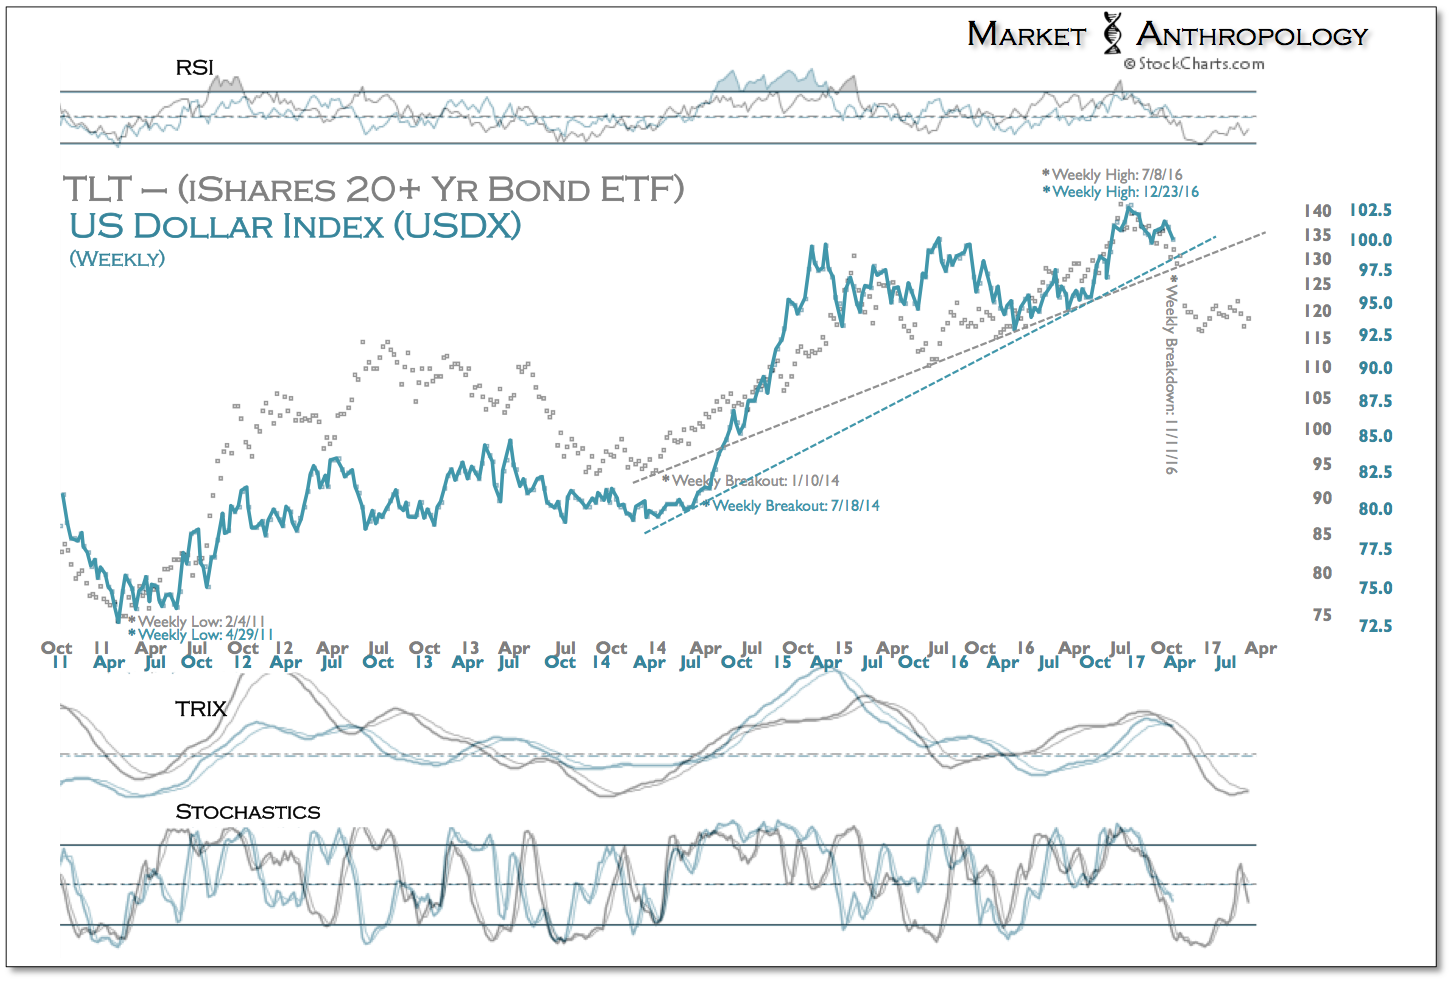
Similar to the failed breakout in long-term Treasuries last summer that subsequently resulted in the severe correction in bonds, the dollar index has followed the retracement pattern in long-term Treasuries as it currently flirts with last November’s upside breakout ~100. Should the index break below current levels, long-term trendline support will be tested directly below ~98.50 and likely fail.
*Click to enlarge images*
As we’ve noted over the years, the relationship between Treasuries and the dollar is highly dynamic, and at times – quite muddled – depending upon the time frame and markets you look at. Granted, this is true for all markets, yet even more so with Treasuries, in part due to the range of durations and also when intermarket correlations are interpreted through yields that inherently behave inverse to their corresponding bond. Simply put – it’s complicated to read and even more confusing to describe.
That said, from a macro perspective we have viewed the dollar following cyclical trends in long-term yields by several years, while over the intermediate term the dollar has followed more structural pivots in Treasuries by several months.

Shorter-term – and as frequently seen in most intermarket relationships, correlations fluctuate between the positive and negative poles, with long-term Treasuries and the dollar index most recently exhibiting an inverse correlation extreme coming into January – the last of which was present during the previous cyclical top in the dollar in the first half of 2002. Consequently, when Treasuries broke down from the failed breakout last November, the dollar broke out. Since then, however, the dollar fell short of making new highs this month as long-term Treasuries recently made new lows.
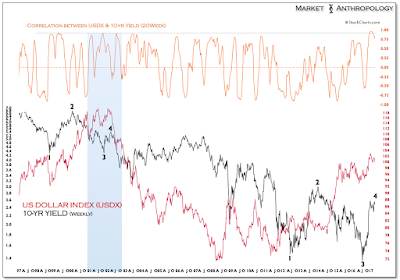
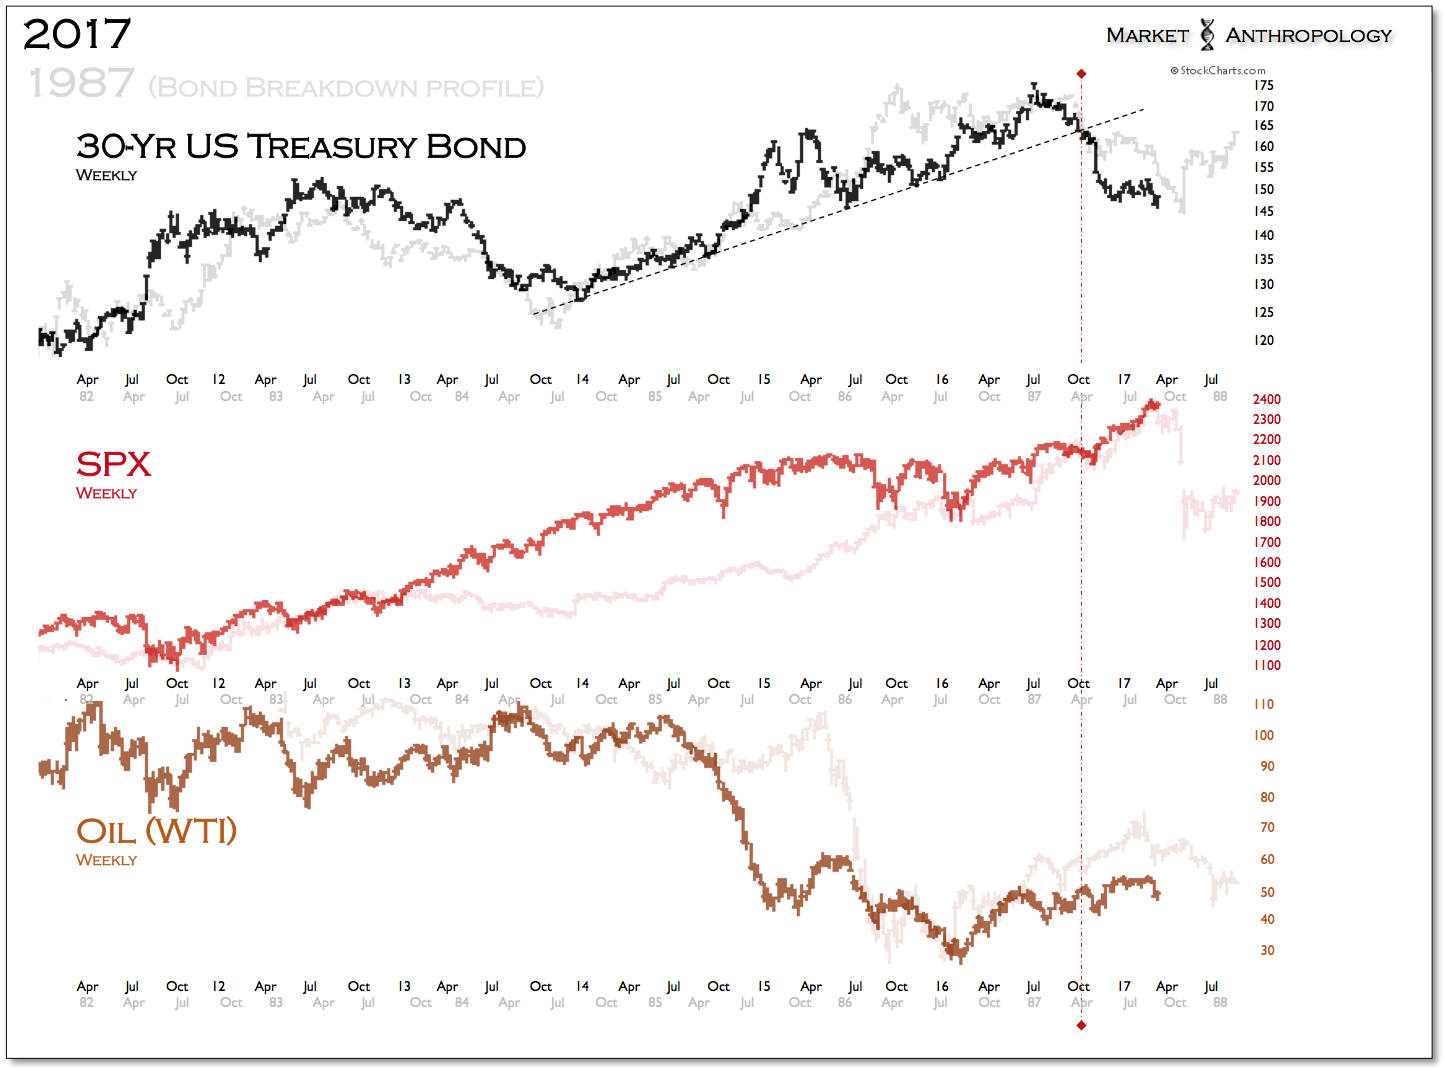
Our interpretation is that the dollar is set to follow Treasuries breakdown lead with the last lagged pivot (~5-6 months) of the cycle, which should mark a pattern break as the dollar turns cyclically lower without a corresponding leading move lower in Treasuries. As we described in previous notes, while we wouldn’t be surprised to see a final leg lower in Treasuries manifest along the lines of the 1987 breakdown to complete the move, over the longer-term we like them from a relative performance perspective to equities. Moreover – and further out on the risk continuum, we still like the prospects of precious metals and commodities that should benefit as the US dollar turns down.
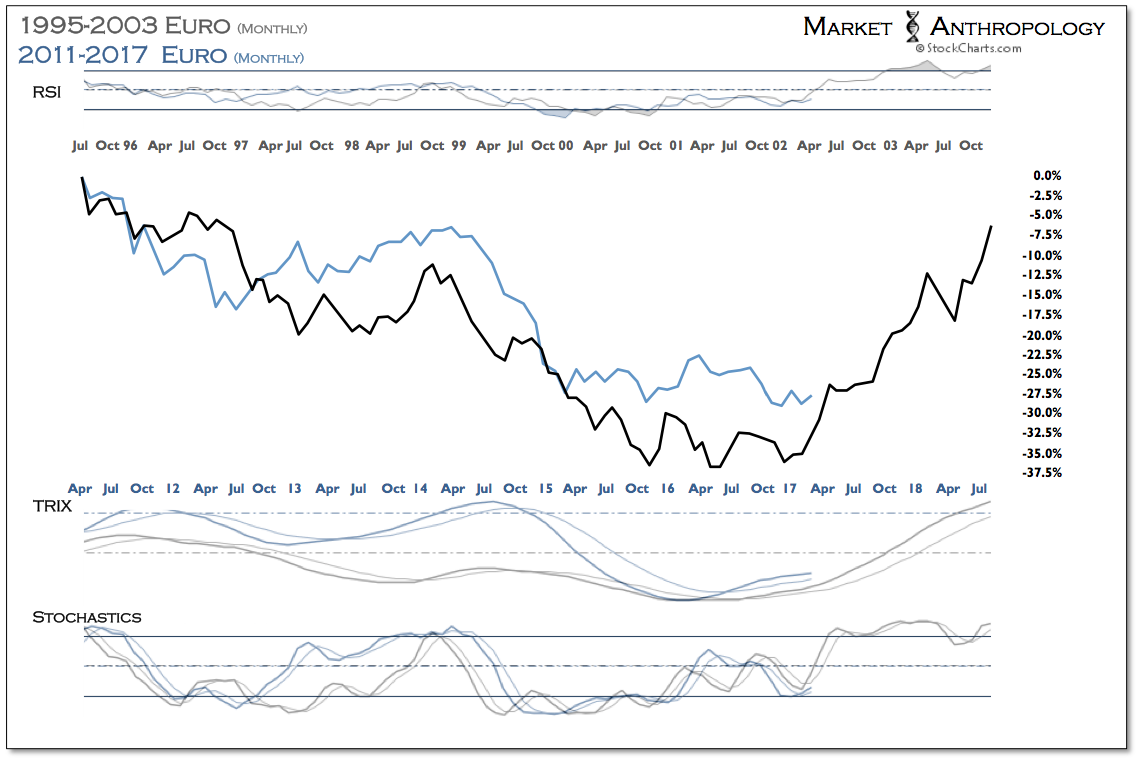
While over the near-term and through an anticipated cyclical pivot lower in US equities, we favor gold here – as it tends to find greater support through broader market weakness than higher beta commodities like silver and oil, on a relative performance basis over the long-term they should all outperform stocks.