
3 Key Economic Indicators May Be Flashing Caution Here

In the note below from Chris Kimble he looks at the commodities index, oil market, and treasury yields. If all these markets turn at around the same time the overall inflation, global growth and interest rate narrative is thrown out the window.Check out the charts and explanations below.
Click here to visit Chris’s site for more great chart commentary.
In today’s 3-pack, we look at the commodities index, crude oil, and treasury yields. A major message to the markets could be underway.
Looking at the charts below, you will notice that all three assets/indicators touched up near their “Long-Term” Fibonacci retracement levels at the same time and could be creating reversal patterns. Could these indicators be sending a monster important message about global growth, inflation and where interest rates are headed next?
Note that a turn lower here by these indicators would be troublesome for the economy… and investors.
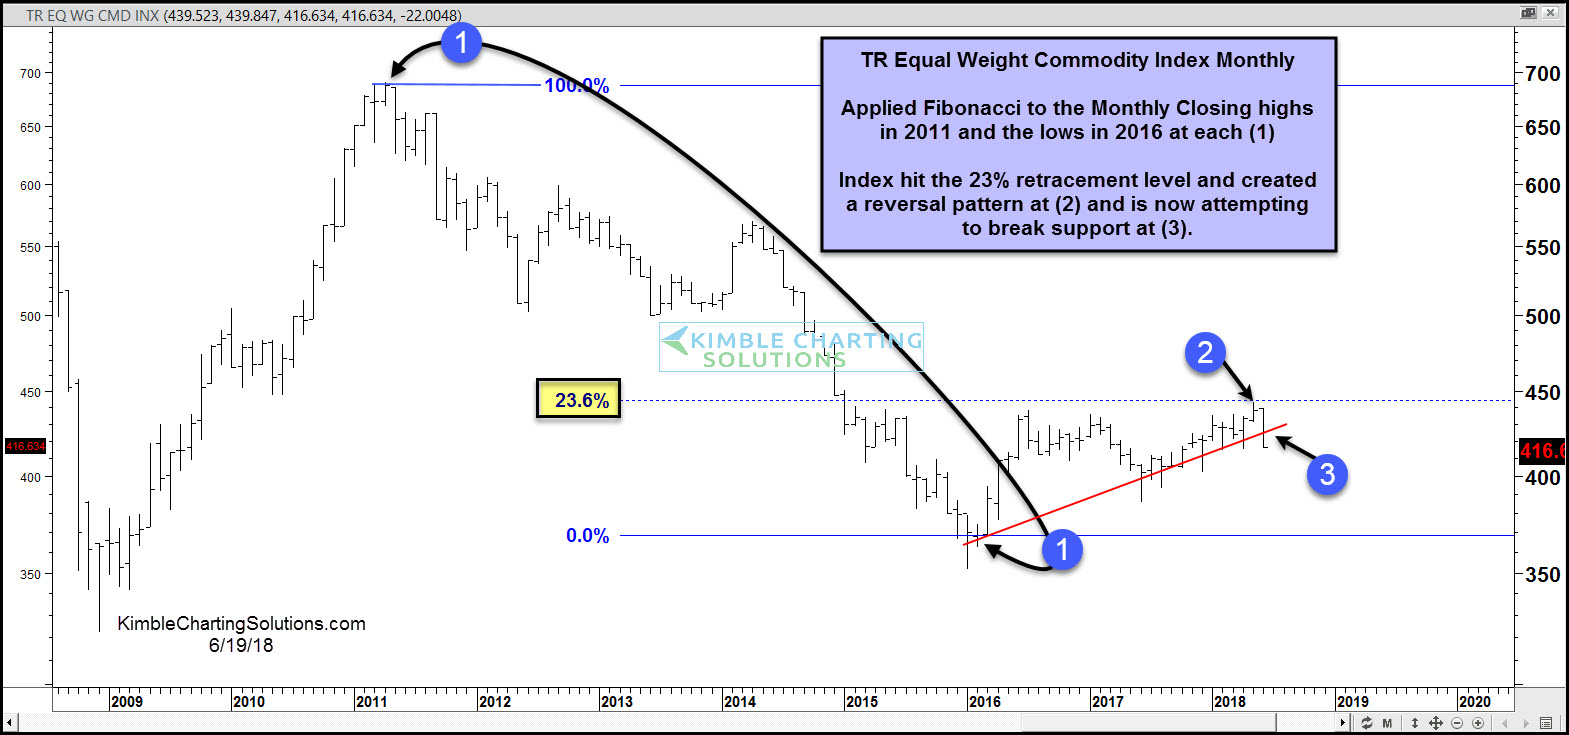
First, let’s look at the Equal Weighted Thomson Reuters Commodity Index. Using the monthly closing highs from 2011 and lows from 2016 (1), we can see that current price hit the 23.6% Fibonacci retracement level (2) and reversed hard. The reversal lower is now attempting to break support (3). Careful here!
Commodities Index “Monthly” Bar Chart
CLICK ON CHART TO ENLARGE
On to crude oil… once again, we used the monthly highs from 2016 and lows from 2011 (1) to calculate our Fibonacci retracement levels. Below you can see crude oil hit the 50% Fibonacci level (2) and reversed lower this month. That reversal has crude oil prices attempting to break an important uptrend line (3). Yikes.
Crude Oil “Monthly” Bar Chart

CLICK ON CHART TO ENLARGE
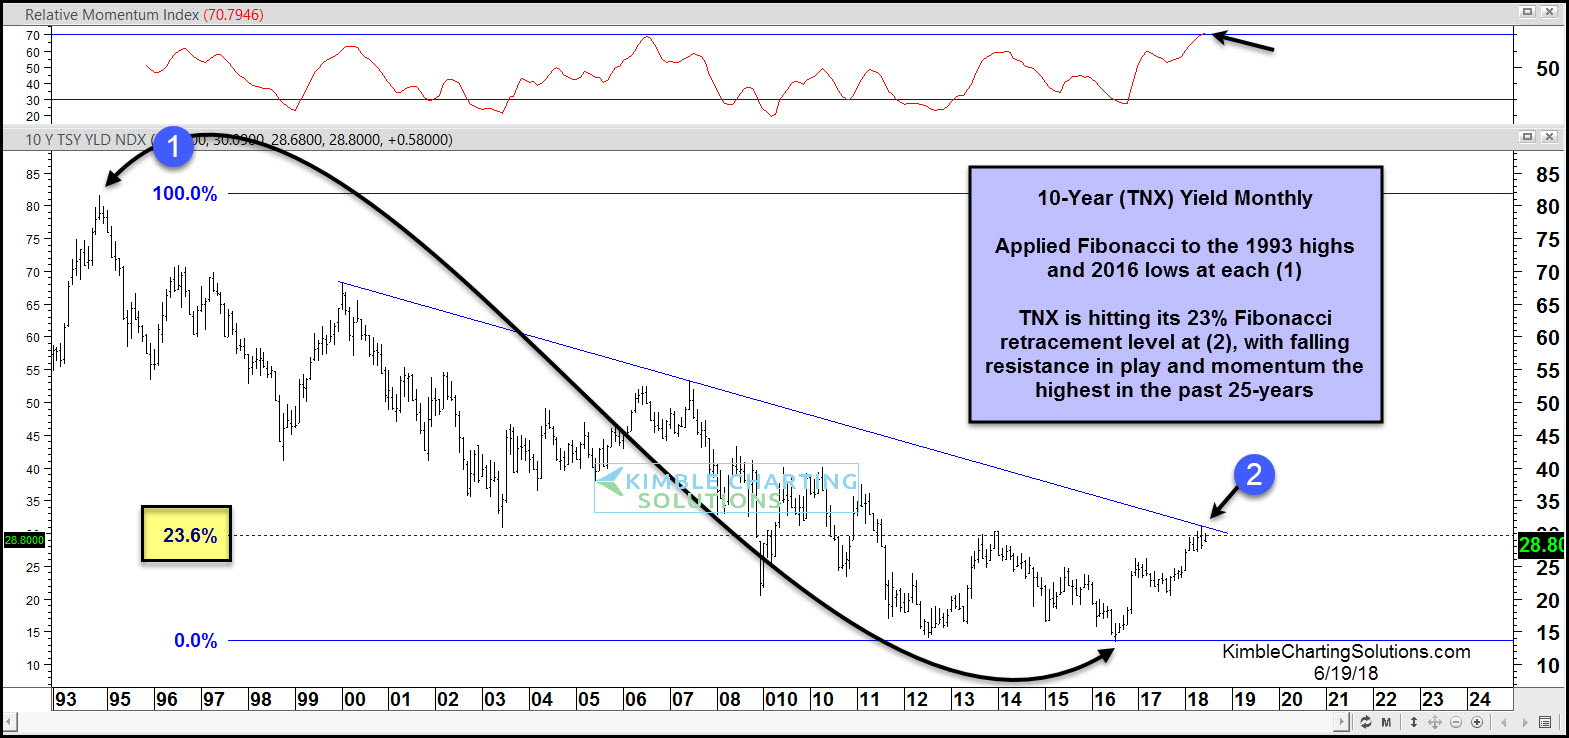
Lastly, interest rates are hitting an important resistance level that may keep inflation concerns in check. The chart below is of the 10-Year treasury yield (TNX).
Using the 1993 highs and 2016 lows for yields (1), we can once again calculate our Fibonacci retracement levels. Here we see yields hitting the 23.6% Fibonacci level at falling trend resistance (2). This dual resistance may be hard to surmount over the near-term, especially as momentum hit its highest level in 25 years!
10-Year Treasury Yield “Monthly” Bar Chart
CLICK ON CHART TO ENLARGE
The Bitcoin : Bubble (music video)
BITCONNECT REMIX
(These excerpts are from the conference that was so over-hyped a year ago before the Bitconnect scam imploded on itself). Haunting & Hilarious how many were hoodwinked on this one…..
Analysts Concerned About Crypto Mining Impact on AMD Share Price
By Ana Alexandre – June 21, 2018
https://cointelegraph.com/news/analysts-concerned-about-crypto-mining-impact-on-amd-share-price
When the air came out of the Bitcoin December 2017 holiday bubble high of $19,346.60 and has crashed down to $6,269.04, the harsh reality that almost all seasoned investors tried to warn people about is gradually setting it.
Now, I do believe there will be another crypto surge, but it will be interesting to see if some of the other cryptos like Ethereum, Litecoin, Ripple, Stellar, Monero, Tether, Tron, Dash, Bitcoin Cash, etc… may start to fight for more market share, or if the global market will decide to pile back into Bitcoin again.
This has been one of the most fascinating phenomenons in speculative investing over the last few years, but when I read comments from the crypto kids lately, they sound as discouraged and precious metals stock investors…. (lol).
Gotta love the doldrums…… Almost time to deploy more funds in all the beaten down sectors over the next month while most are starting to throw in the towel.
This time is NEVER different.
Do You Have A Cryptocurrency Addiction? This British Hospital Has A Treatment Just For You
06/21/2018
US Federal Reserve Launches Cryptocurrency Index
2 hours ago | C. Edward Kelso
https://news.bitcoin.com/us-federal-reserve-launches-cryptocurrency-index/
This will help turn around the commodity sector. Bitcoin looks to be 8% down. Oil is up a nice 3%+. GDX is moving up slightly. Hopefully investors start to realize physical assets are worth more than a digital coin.
Good point Snowy.
AXU and some of the other small miners I look at like USAS have been acting very weak since the beginning of the year. They held up relatively well during this “consolidation,” unlike some of the mid tiers like EXK and AG, which got absolutely smashed. I’ve noticed that EXK and AG have come back at the same time AXU has gone down. It’s like they are trying to converge.
I will note today that AXU and USAS right now are looking weak relative to silver (AXU is down a penny as I write). Pretty darn disappointing with silver up a dime atm. We’ll see how they close. If AXU can close at 1.34 or higher I will be happy. If it closes at 1.33 or 1.32 the weekly candle will be black. AXU hasn’t left behind a single black weekly or daily candle off of the 2016 lows, so I think it is important.
Crypto-Collapse Resumes After Japan’s Largest Exchange Halts Account Creation
Fri, 06/22/2018
https://www.zerohedge.com/news/2018-06-22/crytpo-collapse-resumes-after-japans-largest-exchange-halts-account-creation