
Trading strategies for both US markets and gold

Dana Lyons, Fund Manager joins me to discuss the trading strategy he is employing for both the US markets and gold. While he is still looking bullishly at both these areas he does outline some of the cracks in the broad averages that have caught his eye. For gold it is very encouraging to see Dana paying attention and with a bullish outlook.
Click here to visit Dana’s free blog.
Also click here for his subscriber site where you get more specific trading advice.
IPT is down .05(10%) yet its VWAP (volume-weighted average price) is down just .0127 (roughly 2.3%). In other words, there’s been little interest in selling at anywhere near today’s lows.
I’ve noticed the same thing, and better, in other juniors. A good sign considering their place on the risk spectrum.
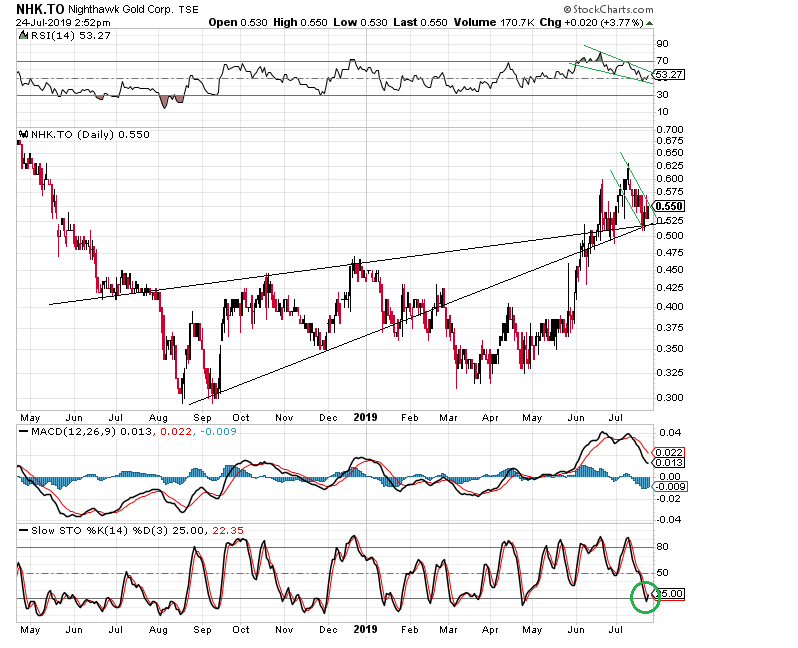
What do you think about the insider buying lately in NHK ?
Something going on?
The chart says its in waiting mood above 0,5-0.55 cad.
Chart from Goldtent
https://goldtadise.com/wp-content/uploads/2019/07/z9094.png
https://goldtadise.com/wp-content/uploads/2019/07/z9093.png
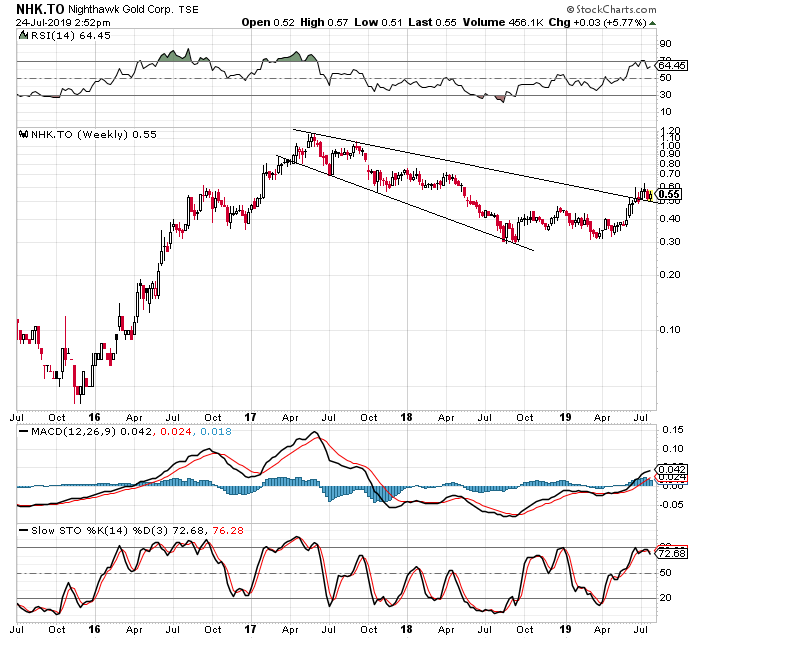
What do you think about the inseder buying in NHK lately?
Something is going on?
The chart says its in waiting mood above 0,50-0,55 cad
I don’t follow that one but the chart is mixed and warrants caution. You want .50 to hold for the weekly closing price or it will head for .47 and then probably .40…
https://stockcharts.com/h-sc/ui?s=NHK.TO&p=W&yr=3&mn=9&dy=0&id=p83313573865
Thanks Matthew👍
typo: insider buying
Matthew – what are your charts telling you on Anaconda (ANX.TO)? Is it ready for the next leg higher or does it need more time? I sold some at the last peak that I want to buy some back.
Both the daily and weekly charts tell me that there’s no hurry to buy BUT we both know how quickly things can change for any nano-cap resource stock.
https://stockcharts.com/h-sc/ui?s=ANX.TO&p=D&yr=0&mn=9&dy=0&id=p22896590460
The weekly chart is mixed but has a bearish bias for sure:
https://stockcharts.com/h-sc/ui?s=ANX.TO&p=W&yr=3&mn=11&dy=30&id=p41949606352&a=678638894
Thanks Matthew. That weekly fork chart is interesting. I suppose it could double bottom back to the early 2016 low? Seems like a fairly low probability. Is it common for price to skirt down the upper fork support of the downtrending fork and find support at the lower fork support of the larger uptrending fork?
Today’s pullback in gold has not done anything (so far) to negate the prospect of continued near term upside:
https://stockcharts.com/h-sc/ui?s=GLD&p=D&yr=0&mn=7&dy=0&id=p93239455419&a=678425491