A guest on the show Peter Brandt sent this post to me today. Peter is very technically focused so he takes us through what he sees in the silver chart below.

Here is his rundown:
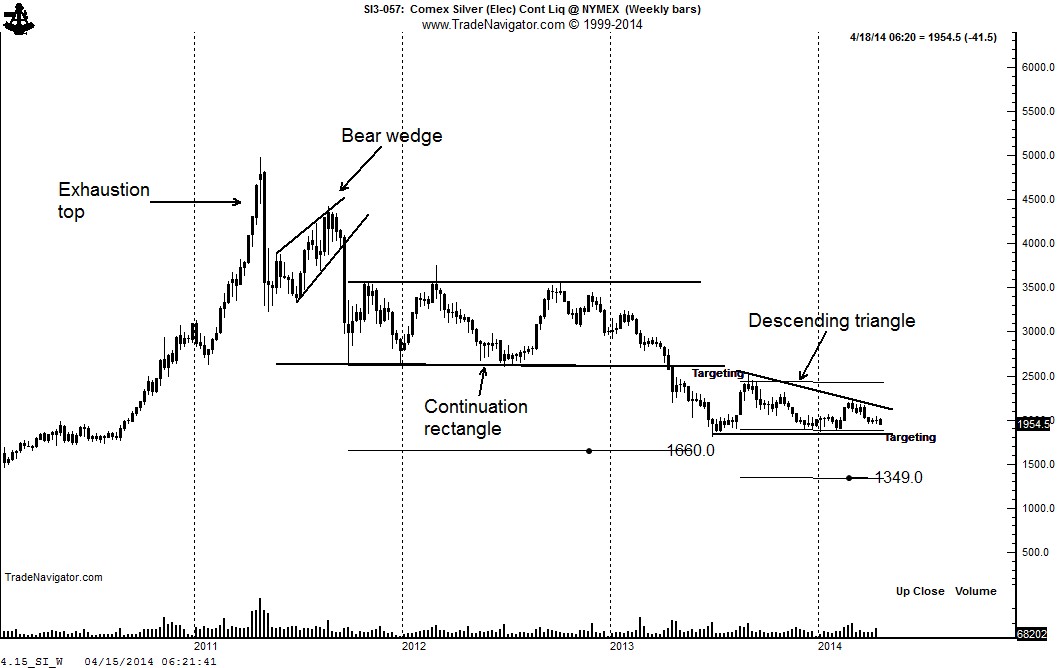
Phase A was the blow-off exhaustion top experienced in April 2011. This blog correctly identified this as an important market top. See here (How do you spell bubble … SILVER, Apr. 24, 20111) and here (8 years of Silver supply changed hands last week, May 1, 2011). The blow off was immediately followed by a 35% price decline — with Silver bulls declaring a conspiracy.
Phase B was a retest of the top, taking the form of a bear wedge.
Phase C, lasting from October 2011 through April 2013, represented a rectangle. Phase D was a textbook horn or sloping top in the final stages of Phase C. It was during this horn, on February 20, 2013 that this blog carried a post titled “What’s happening to the metals – a chart update.” This post predicted a sharp decline in precious metals, specifically identifying a target of $1250 for Gold, the priced at $1570. The completion of the continuation rectangle in April 2013 set a still-unmet target of 1660. Remember, targets are not sacred. Also keep in mind that while I have made some insightful calls over the years, I also have many market pronouncements leading to a over-sized serving of humble pie.
Phase E has been the unfolding congestion since the June 2013 low. This congestion appears to be taking the form of a descending triangle with support in the 1800 to 1850 zone. Should this support give way, then the 1660 target would be quickly met, with a further target down to 1350.
Click here to visit Peter’s site and read his full post.
And you can click here for Peter’s homepage to check out what other charts he is following today.