With the market maintaining support this past week, and rallying off that support, it now seems we are almost done with our wave IV rally, albeit a bit premature, since I ideally wanted to see it completed around Thanksgiving time. For now, the market seems to be setting up to complete this upside corrective wave structure within the early part of the coming week.
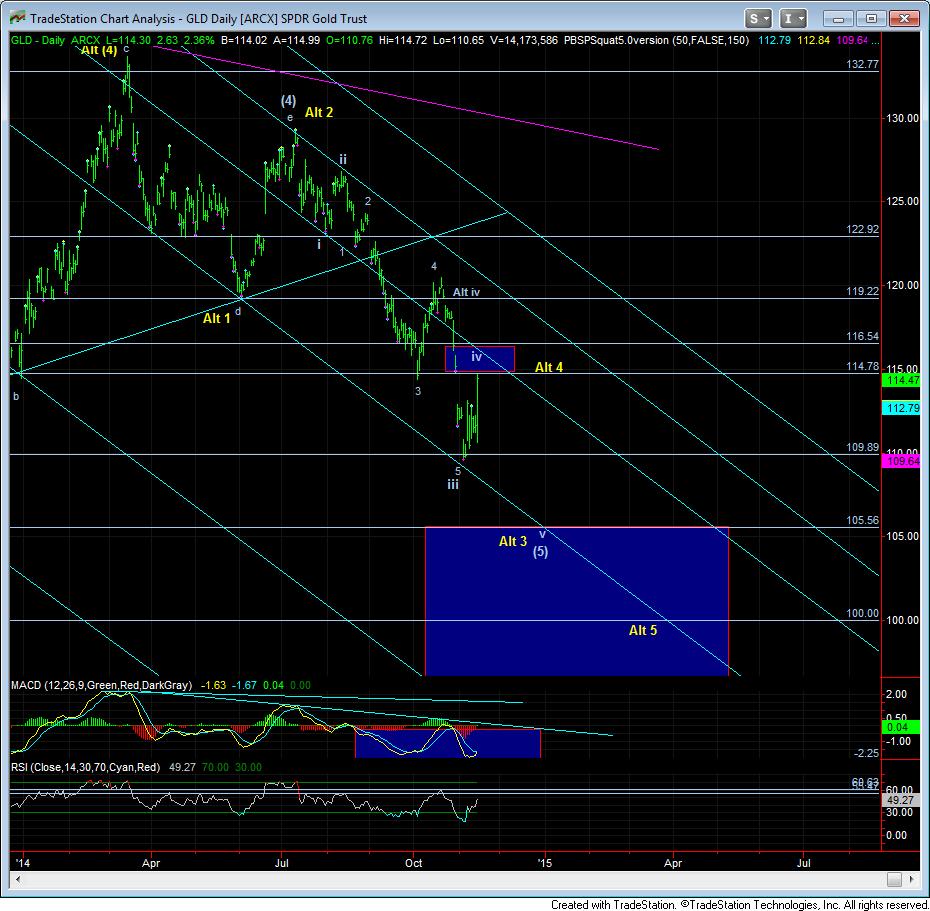
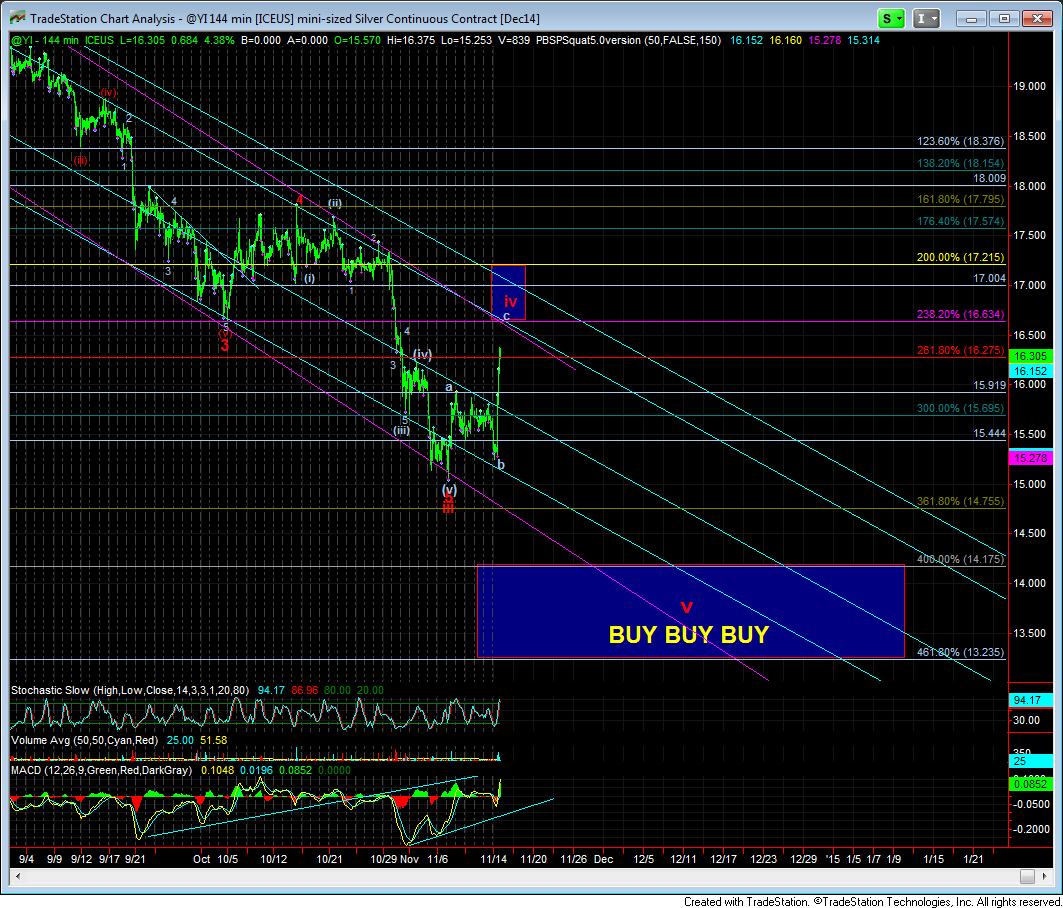
Last weekend, I noted that we were setting our target for wave IV in the 114-116 region in the GLD. On our daily GLD chart, our minimal target was the 114.78 level, which we came within 5 cents of striking on Friday. On silver, it looks like we will be targeting the 16.65 region for the top of this wave IV.
On Thursday night, I sent out an update that noted that there was no imminent structure for the metals to break to the upside, as I was expecting further consolidation or a break to the downside, which would then set up the rally to the higher highs. In hindsight, that provided to be quite prescient, as just hours later, the market dropped to provide us a much better entry opportunity for the long trade we expected to see for the c-wave of the 4th wave.
For those in the Trading Room on Friday, just before the open, I noted a trade set up in the GDX – which was more clear than the equivalent set ups in the GLD or silver charts at the time. Larry White – our miners analysts within our Stockwaves service at Elliottwavetrader.net – also posted an alert in Stockwaves regarding the potential trade set up. The trade set up was looking for a buy in the 17.60 in region in GDX, and using a 35 cent stop. The ideal target was the 20.50 region in the GDX. I specifically noted that the trade was risking only about 35 cents for the potential of a 3 dollar trade. And, as we now know, the market rallied from within pennies of our entry point, and provided a 9% gain in GDX from the entry point before the day completed.
While the 20.50 region in the GDX had been my ideal target for this 4th wave for quite some time, it appears we may not be able to exceed the 19.60 region if all charts do not see further extensions early next week. In fact, the way we completed the day on Friday seems to have been within the 4th wave of the c-wave of this 4th wave corrective rally. This means that we will not likely be able to move through the 116 region in the GLD and the 16.65 region in silver. In fact, if we do not see extensions in this wave, we can even see this 4th wave complete as early as Monday of the upcoming week. Confirmation will be seen once the market turns down in its first 5 wave structure, followed by a corrective 3 waves back up. That will be our signal to short for what we think will be the final drop in this 3+ year correction in the metals.
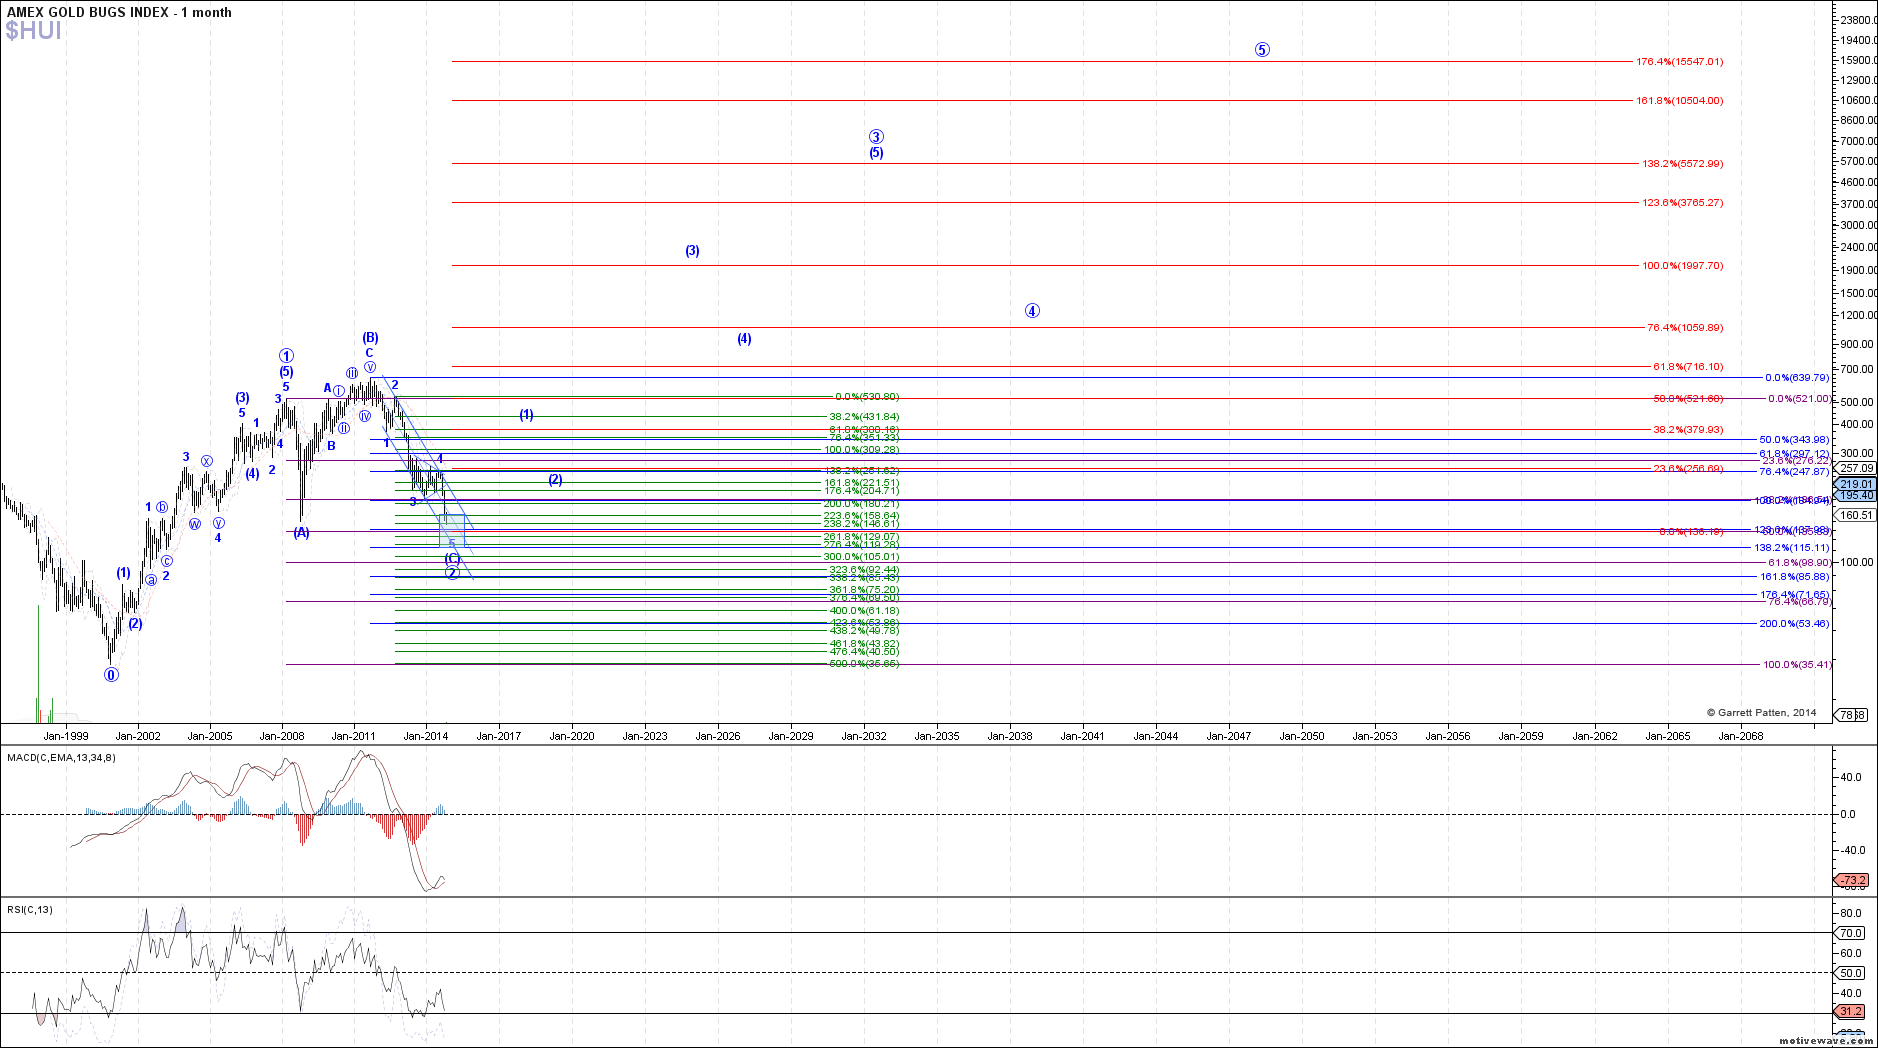
So, we will be watching the pattern in the early part of the upcoming week in order to determine just where this c-wave of the 4th wave will top. In the meantime, I would like to continue to focus on the larger degree perspective, as I think too many are focusing on the smaller time frames, and not focusing enough on the larger time frames. Therefore, I am now going to focus upon the next 10-30 year time frame in metals. And, thanks to Garrett’s chart on the HUI-Gold Bugs Index, we have a nice representation for you to focus upon for the longer term time frames.
As you can see from Garrett’s HUI chart, based upon our Fibonacci Pinball method of Elliott Wave analysis, and using log scale calculations, we see the potential for more than a ten-fold increase in price for the Gold Bug Index within the next 10 -15years, with the further potential of thirty-fold increases over the next 20-25 years. And, it seems that the initial parabolic stage does not occur until the 2018-2020 time frame.
For many of you, this is likely music to your ears since you have been dreaming about this potential for decades, as you have maintained your belief in the imminent collapse of the monetary system. Others are probably looking at this as nothing more than the ranting of some crazy analyst.
But, while past performance is clearly not indicative of future performance, I want to remind you of something I said back in 2011. In my first gold article on Seeking Alpha on August 22, 2011, I provided my topping target for gold, in the face of the parabolic run, when everyone was so certain we would be easily seeing over $2000. And, if you remember, gold topped within a few dollars of the target I provided a month before the top was struck.
But, what someone just reminded me of the other day, in response to a question from a commenter to that article, and even BEFORE gold actually topped, I provided the downside targets on August 23, 2011:
Based upon the Elliott Wave Principle, I would expect a very large pullback. In fact, the target for such a pullback will probably be a minimum low of $1,400, it could fall as low as $1000, or even as low as $700. It will depend upon how the decline takes form. But those are very viable targets for gold on the downside.
And, if you remember, when gold was up at the 1400 region, I gave it an opportunity to prove that a low had been struck. And, when it invalidated that potential, we started looking much lower, towards the 95-105GLD region target I have maintained since that time.
Now, based upon this same methodology that identified the 2011 top and the current bottoming potential, I am now providing you with the long term upside targets we see for the next 10-30 years in metals and miners. So, you can do with it what you will, but I know how I will be handling this information.
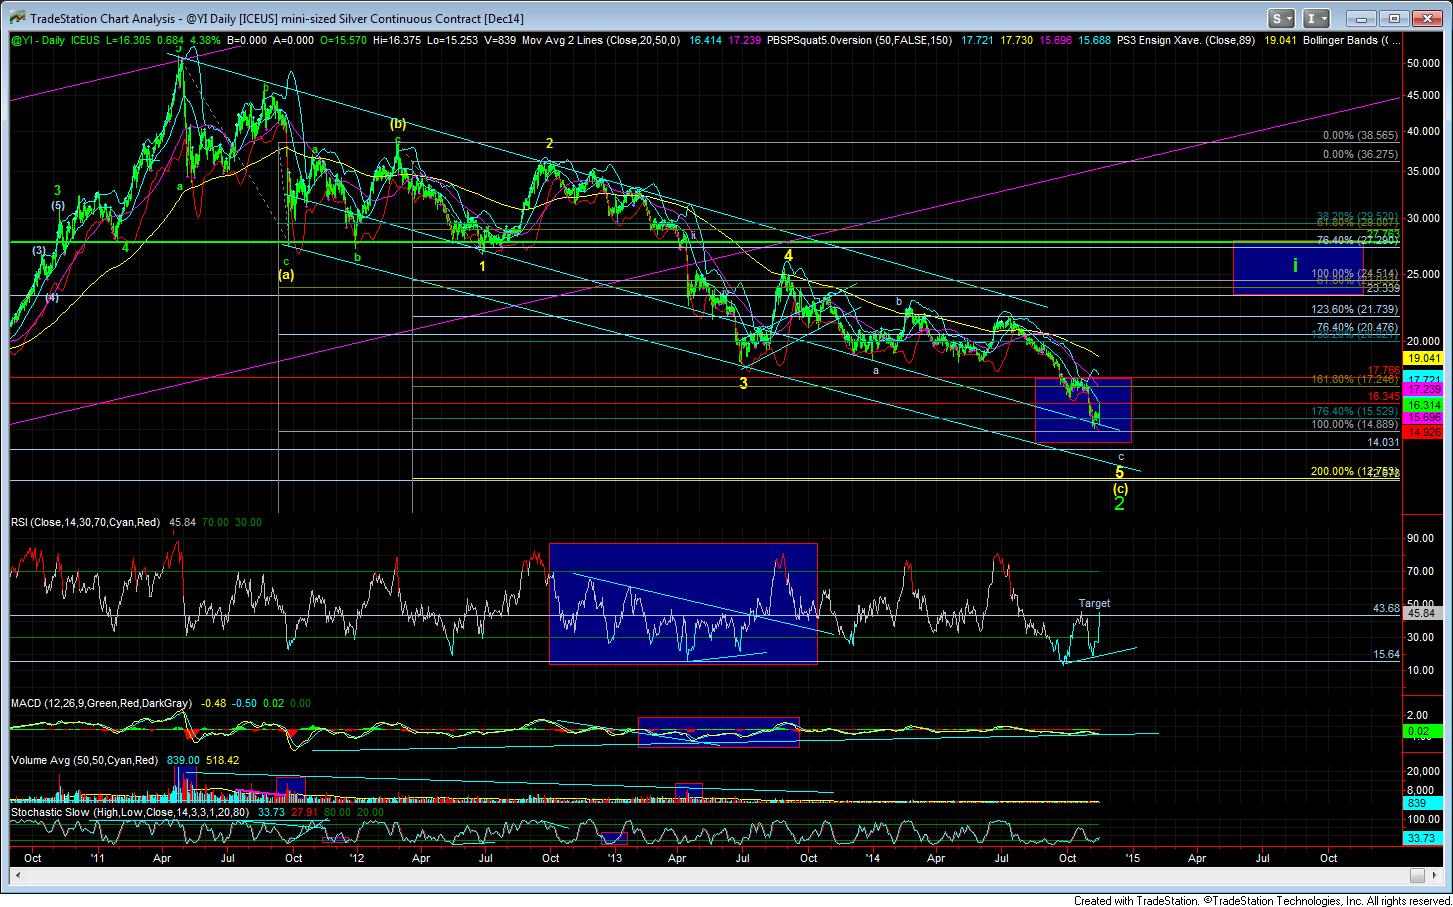
As for the next lower downside targets we will be looking for once we obtain confirmation that wave V down has begun, we will be looking for a minimum target of 105 in GLD and a minimum target of 14.17 in silver. Please also note the next lower “BUY, BUY, BUY” target region listed on my 144 minute chart. As I said long ago, I am going to be suggesting 2-3 buying regions to scale into long term positions to set us up for the next larger degree bull market phase we are expecting once we complete this 3+ year correction.
For those that are still contemplating joining Stockwaves for Larry’s miners analysis (along with Zac and Garrett’s stock analysis, with Garrett’s expanded focus upon the best stocks he will be identifying by sector), we are giving members another two week window to join this service at the current rate (which will remain your rate for as long as you remain a member in Stockwaves) before prices will be raised as of December 1, 2014.
GLD Daily

Silver 144min

Silver Daily

$HUI – Primary Analysis – Nov-11 1519 PM (1 month) – Click for larger image