Here is a short post about how the saying “sell in May” is not exactly a good idea. This post was authored by the guys over at Short Takes – click here to visit their site.
A Cute Little Rhyme
Having worked on Wall Street for over twenty years, I have had countless conversations about the seasonal tendency for investors to “sell in May and go away”. Wikipedia describes the concept this way:
“Sell in May and go away is an investment strategy for stocks based on a theory (sometimes known as the Halloween indicator) that the period from November to April inclusive has significantly stronger growth on average than the other months. In such strategies, stocks are sold at the start of May and the proceeds held in cash; stocks are bought again in the autumn, typically around Halloween. It is the belief that it’s better to avoid holding stocks during the summer period.”
Markets Are Not That Easy
Investors like market forecasts because they want to feel like they have some control over what in the real world is a very uncertain future. Investors like seasonal patterns for the same reason. Does it make sense to solely base your investment strategy on any seasonal pattern? Markets take all factors into account, including seasonal tendencies, Fed policy, earnings, valuations, geopolitical tensions, and systemic risk. The list of factors impacting asset prices is almost endless and goes well beyond a cute little rhyme like “Sell in May and Go Away”.
What Does History Say?
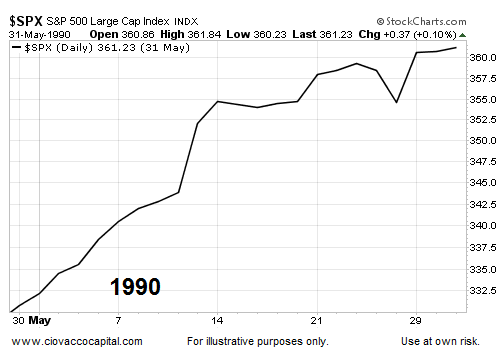
If you sold on April 30, 1990 and sat out the month of May, you missed a eye-popping 9.20% gain in the S&P 500.

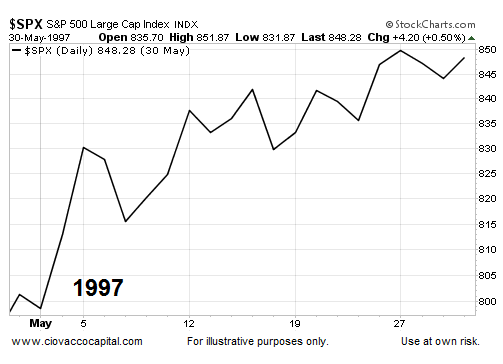
In 1997, stocks returned 5.86% in the month of May, making the “sell in May” crowd very uneasy.
What Does The Bigger Picture Look Like In 2015?
Seasonal patterns can be helpful, but taking a broader view of risk-and-reward easily passes the common economic sense test. This week’s video looks at numerous markets allowing us to peek behind the probability curtain based on hard present-day data, rather than a rhyme.

Back To The History Books
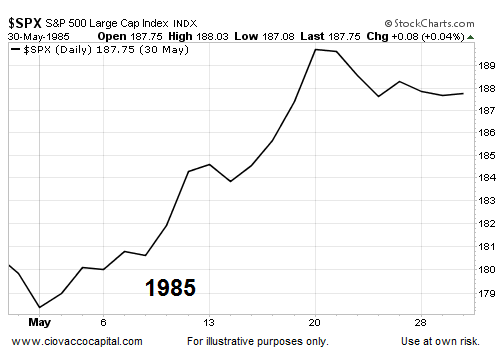
In the spring of 1985, Coca-Cola introduced the “New Coke” much to the dismay of the soft drink consumers. The stock market was a bit more cheerful, posting a 5.41% gain between the end of April and beginning of June.
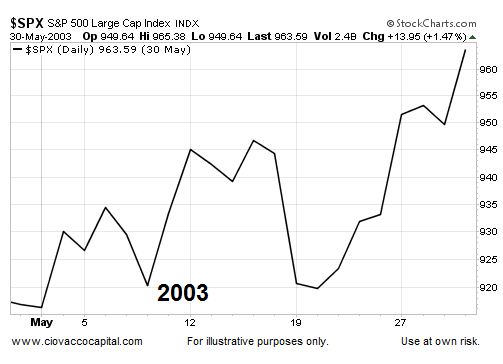
While many were still very skeptical about stocks in the wake of the dot-com bust, the charts were saying “things are looking better”. The S&P 500 agreed by tacking on 5.09% in May 2003.
But, The Market Was Different Then…Right?
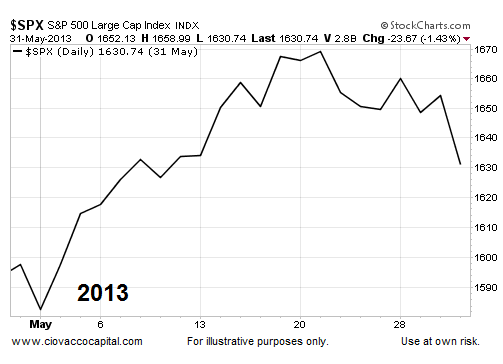
The market is always different, which is why ignoring present-day data and instead relying on the history books can produce very disappointing results. Those who chose to move to cash on the last trading day of April 2013, missed a 2.08% gain in the S&P 500.
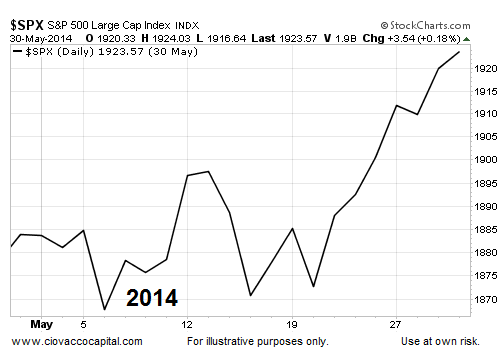
“Sell In May” was not particularly helpful in 2014 either. The S&P 500 advanced 2.10% in May of last year.
Investment Implications – The Weight Of The Evidence
According to moneychimp.com, since 1950 the S&P 500 has been green in May 37 times and red 28 times, with an average change of 0.11%. An average gain of 0.11% is nearly a coin flip, which aligns with the “pay attention to the current data” approach. The current data, as outlined in the video above, is still calling for an equity-heavy allocation. When the data calls for a reduction in our exposure to stocks, we will not hesitate to make the necessary adjustments.