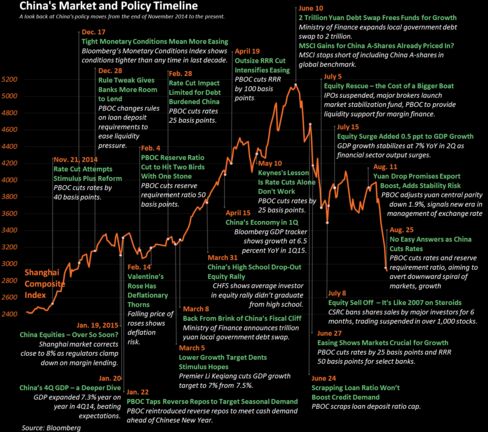
This post includes a great chart outlining the policy changes by China since late 2014. The PBOC and government have gone so many different directions to keep the market going and then to stop the fall, nothing seems to be making any more than a short term impact.
Click here to visit the original posting page over at Bloomberg.
…
Chinese stocks continue to plunge. Despite a Tuesday rate cut from the People’s Bank of China, the $5 trillion rout rolls on. Authorities in China have escalated their blame game, looking for market selloff scapegoats. The situation has captured the attention of the world, and market reverberations everywhere are being attributed (at least in part) to what’s going on in China.
Bloomberg Intelligence economist Tom Orlik has put together a fantastic, annotated chart that shows both the market’s huge upswing and subsequent crash. As he notes, “Along the way there have been five rate cuts, a raft of interventions from the government aimed at stabilizing the market and a global stock correction with China at its core.”
(Click the chart to enlarge or click here to see full size.)