Market Moves That Aren’t Supposed to Happen Keep Happening
Being a numbers guy I find the stats presented below to be very interesting. We all know the markets have been very volatile recently but understanding just how volatile is important. As you will read below we are seeing moves not seen in the markets since 1975.
Click here to visit the Bloomberg page where this article was originally posted.
…
A counterpoint to Bill Dudley’s Wednesday speech on bond market liquidity comes courtesy of TD Securities.
While the New York Fed president argued that there’s little evidence so far that new financial regulation has cut into the ease of trading U.S. Treasuries, TD analysts Priya Misra and Gennadiy Goldberg think otherwise. They point to daily, wild swings in the bond market as evidence of diminished liquidity.
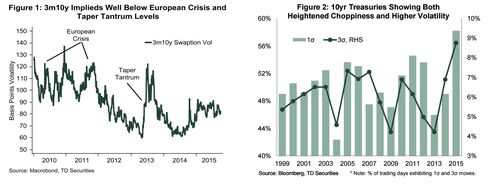
Our findings show that daily changes in 10-year Treasury yields exceeded one standard deviation (σ) 58% of the time so far in 2015—considerably higher than the 49% observed last year (Figure 2). The 58% measure is the highest reading going back to 1975, suggesting that recent volatility in Treasury markets is unprecedented. As if a record number of “choppy” days were not enough, 10-year yield movements also exceeded 3σ in as many as 9% of trading days this year. This is higher than the average of 6% of days since 1975.
Source: TD Securities
It’s a point that’s been brought up before, notably by Bank of America Merrill Lynch’s Barnaby Martin. These observers argue that the number of assets registering large moves—four or more standard deviations away from their normal trading range—has been growing in recent months.
Moves greater than one standard deviation should (based on a normal distribution of probabilities) happen about 32 percent of the time. Instead as the TD analysts point out, they are happening 58 percent of the time in U.S. Treasuries. Moves greater than three standard deviations should be happening about 1 percent of the time, not 9 percent.
While Dudley finds little evidence of average bond market liquidity having deteriorated, TD reckons the problem lies in so-called “tail events,” in which increased regulation and changes to market structure exacerbate the potential for extreme moves. Looking at average liquidity conditions won’t show much evidence of a problem, therefore. That might go some way toward explaining why all those market moves that are supposed to not happen very often keep occurring with some regularity.
Here’s TD’s thinking:
The issue, as reflected by our sigma measure, may very well be one of “fat tails problems” and lower liquidity during these tail events due to lower dealer risk appetite. The argument is that an unexpected macro event or large-sized risk transfer has the potential of creating much larger market moves today compared with the past. This would be consistent with a greater number of days in recent months exhibiting 1σ or 3σ sigma moves. The taper tantrum and the October 15, 2014 event where Treasury rates moved amid very little news would be some examples of these events in recent times. Interestingly, an increase in volatility and reduction in depth can be self-reinforcing, in which reduced depth causes any risk transfer to have a greater price impact, while the resultant volatility causes market depth to shrink further.
The counterpoint to this is that heightened volatility could very well have little to do with liquidity. That’s arguably a scarier scenario because it would mean that we have absolutely zero understanding of what’s driving more extreme market moves, other than the basic premise of greater investor uncertainty.