For all of our technical listeners here is breakdown of a number of chats focused on the CRB (Commodity Research Bureau Composite). It is important to note that the CRB is currently comprised of a number of commodities but not including precious metals. Here is what is included…
- CRB BLS Metals: Copper scrap*, lead scrap, steel scrap, tin, and zinc*.
- CRB BLS Textiles and Fibers: Burlap, cotton, print cloth, and wool tops.
- CRB BLS Livestock and Products: Hides*, hogs, lard, steers, and tallow.
- CRB BLS Fats and Oils: Butter, soybean oil, lard, and tallow.
- Raw Industrials: Hides*, tallow, copper scrap, lead scrap, steel scrap, zinc, tin, burlap, cotton, print cloth, wool tops, rosin, and rubber (59.1%).
- CRB BLS Foodstuffs: Hogs, steers, lard, butter, soybean oil, cocoa, corn, Kansas City wheat, Minneapolis wheat, and sugar (40.9%).
As I mentioned the article below is very technical but there are some interesting charts the author references.
Click here to visit the posting page over at StockCharts.com.
…
- A test of the bear market low for commodities is underway
- Relative commodity action favors metals and agriculture
- Stocks to continue to outperform commodities
This week I am focusing on commodity prices, or more specifically on the Commodity Research Bureau Composite ($CRB) to see what might need to take place in order to call a primary trend turn. At the moment, the trend indicators are definitely bearish. For instance, Chart 1 shows that the CRB Index around 166 is well below its declining 12-month MA. You can also see that it broke down from a 40-year support trendline a few months ago. Using the maximum distance between the high and the breakdown trendline suggests a downside objective that is literally off the charts. However, if we use the distance as calculated from the 1980 and 2011 peaks, which are more or less identical, we find an indicated downside objective close to the 1972 low. You can see from the chart that there is very little in the way of major support between current levels and that 1972 bottom, so it’s not impossible that commodities will eventually sink that low. Even so, the blue arrows show that reversals in this indicator have consistently called primary trend bull markets during the last 40 or so years. Right now this indicator is at a marginal new record low, which means a turn is likely. It’s not yet reversed of course, but this momentum series needs increasing doses of weakness in order to maintain its downward trajectory.
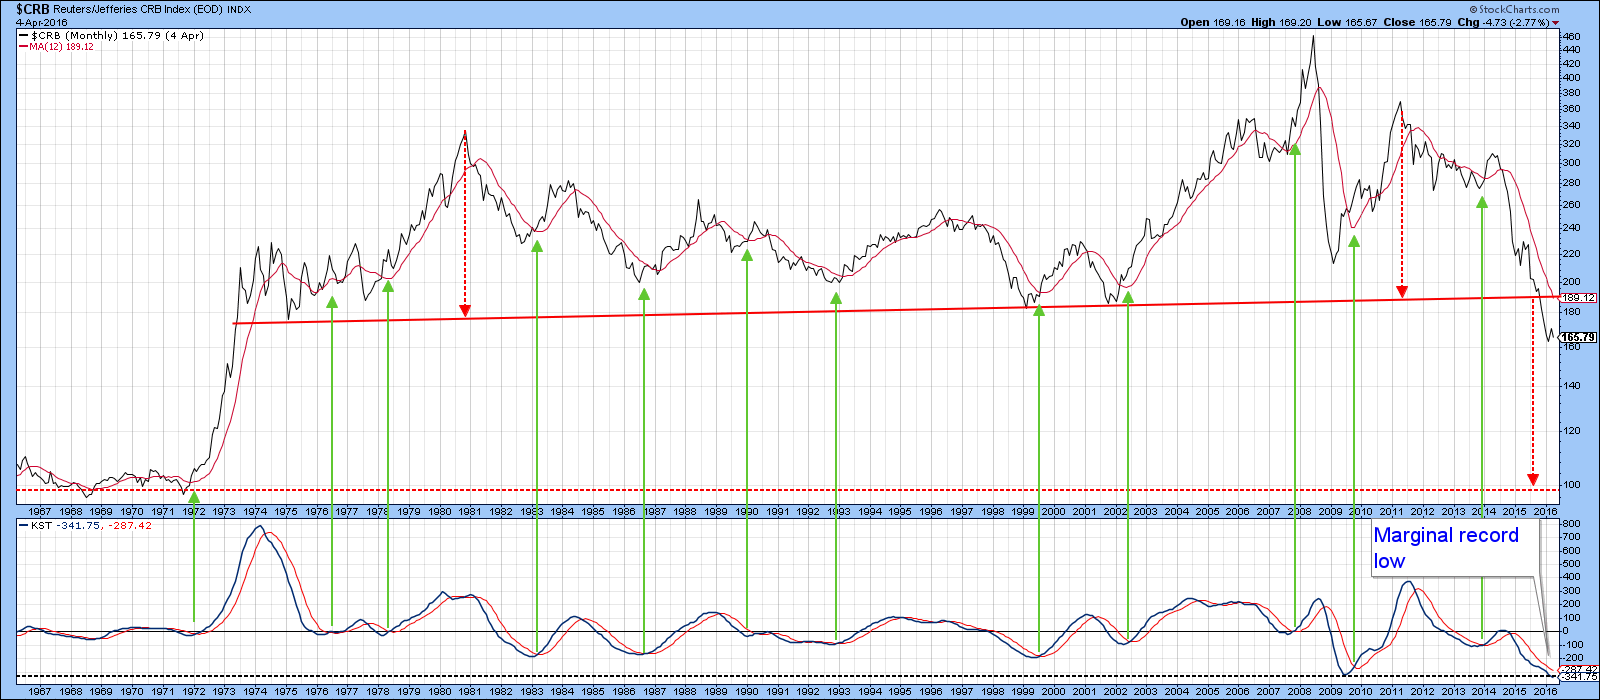

Chart 1
One indicator that has bounced is the 18-month ROC. Reversals from an overstretched level have consistently called a new bull market in commodity prices, so this is definitely a positive factor.
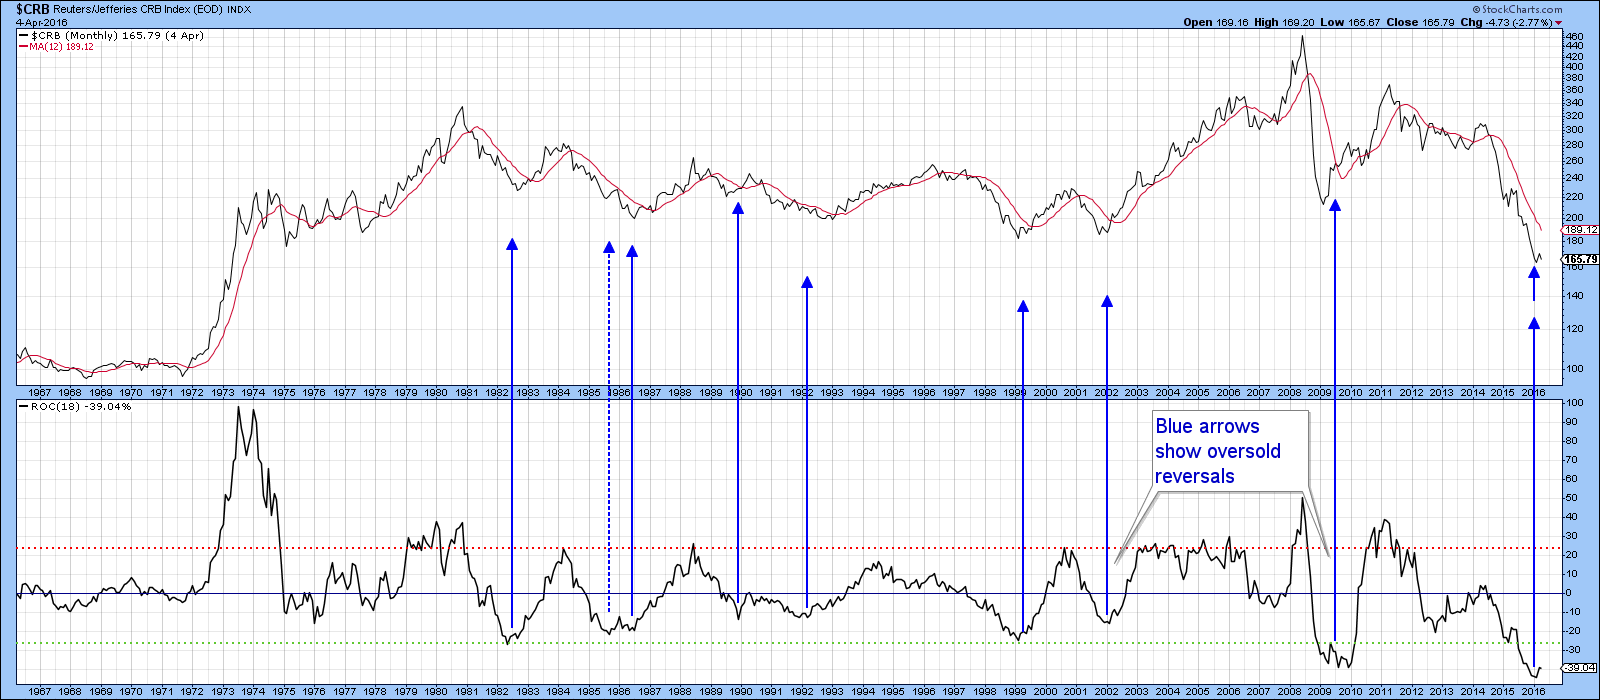
Chart 2
The sets of two small green arrows in Chart 3 point out the fact that most $CRB Commodity Index bear market lows experience a small double bottom, as the secondary test truncates at a higher level than the initial low. The fuchsia-colored arrows show that occasionally there is no test and commodity prices reverse on a dime. The large green arrows indicate upside reversals in the Coppock indicator. There are a couple of false signals but by-and-large, it works very well. Note that it has recently reversed to the upside thereby adding fuel to the bullish case. At this point, though, the technical evidence is pointing to the fact that some form of a test of the recent low is underway.
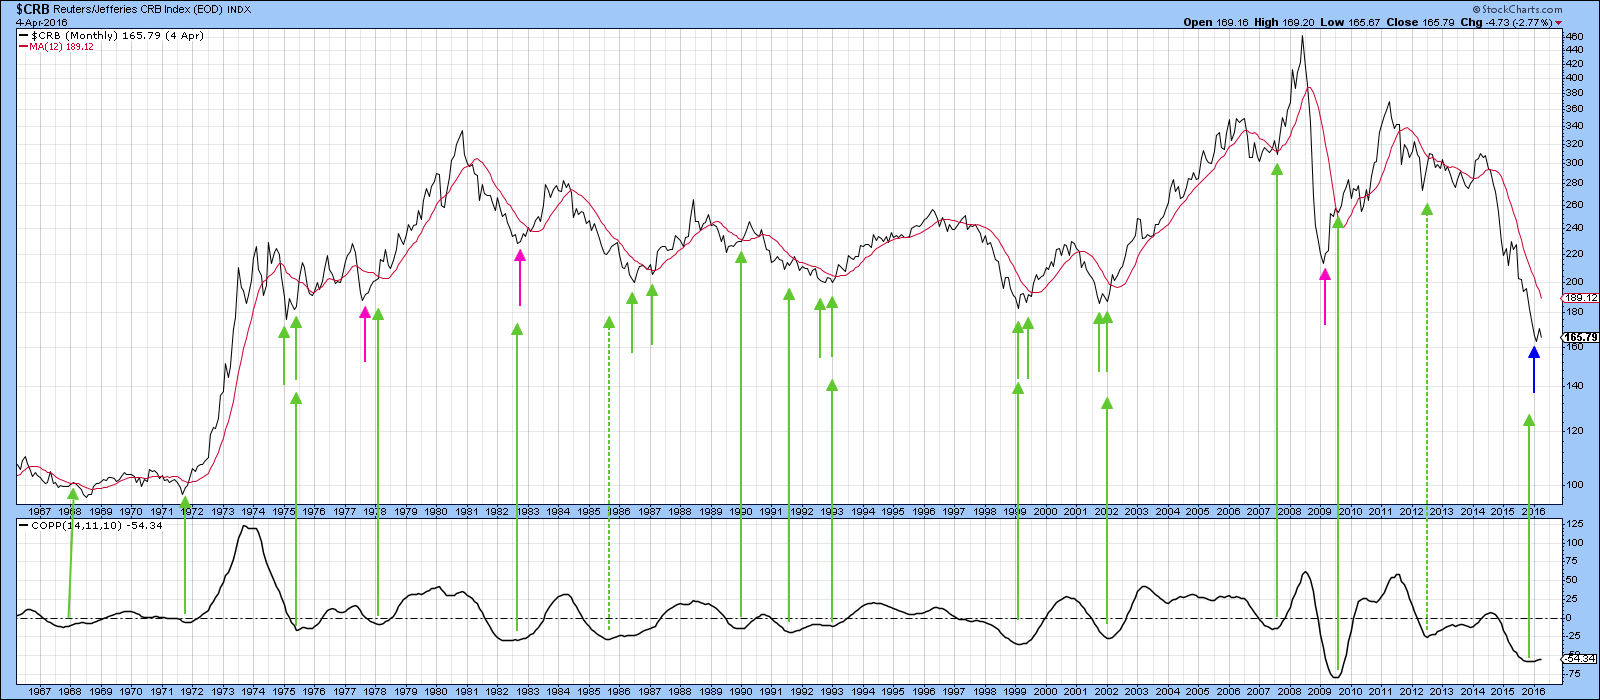

Chart 3
A test of the bear market low for commodities is underway
For example, Chart 4 features my Commodity Net New High Indicator (!PRNNHCO50), which monitors a basket of commodities registering new highs based on a 50-day time span. The red arrows show that when it has reached an extreme in the past, the Bloomberg Commodity ETN (DJP) has generally fallen in price. We need to bear in mind that these were all bear signals triggered in a bear market i.e. pro-trend signals. Pro-trend signals are usually stronger than contra-trend moves. You can appreciate this to some extent by the fact that the green buy signals all went against the declining trend and most were inconsequential in their effect compared to the strength of the red sell signals. The point I am trying to make is that if the early-2016 low turns out to be “the” bottom, the current short-term decline will likely be relatively brief. The signal I would look for to confirm the positive action in the 18-month ROC would be a successful test of the low and a rally to a post-March high. That way the price action would have achieved a series of rising peaks and troughs for the first time since the bear market began in 2011.
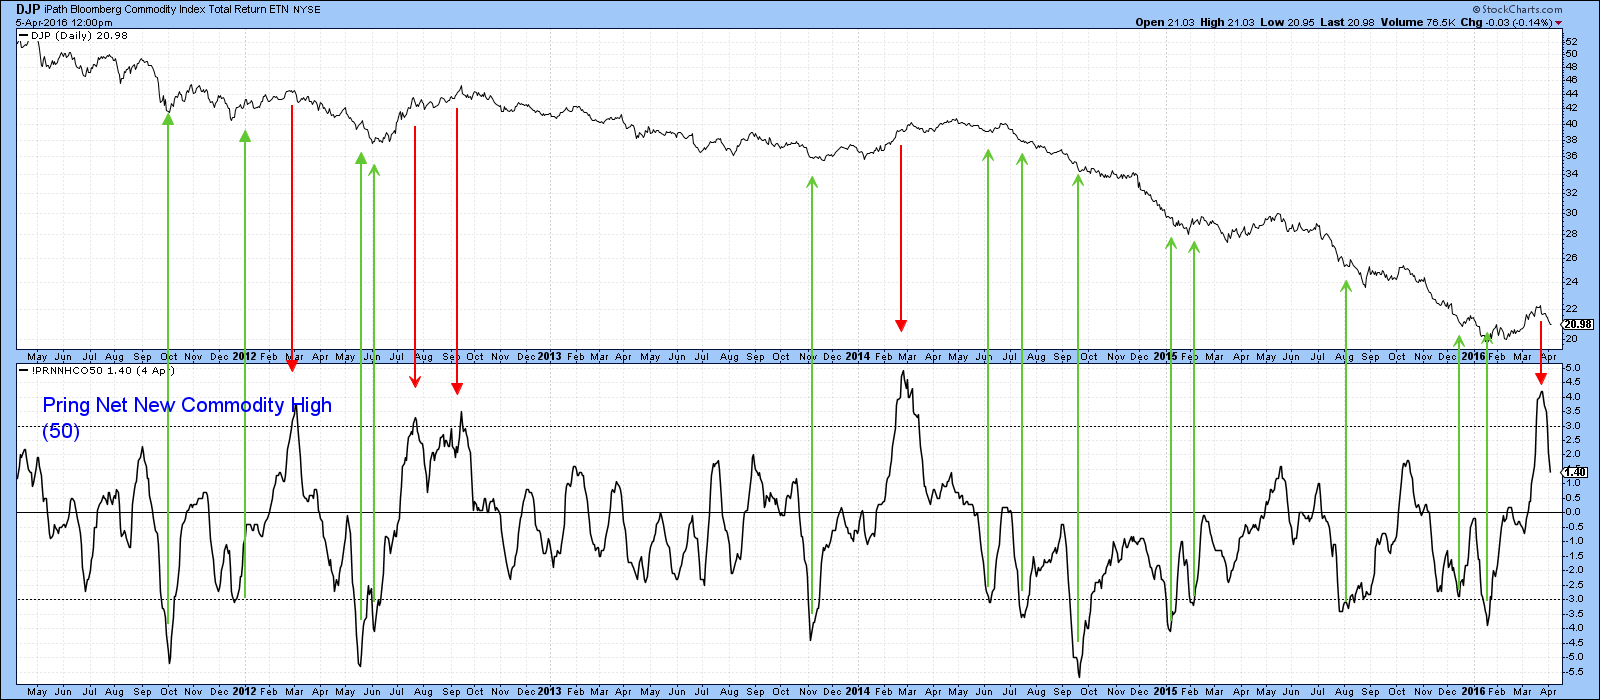
Chart 4
Chart 5 offers a different take with a different commodity index, The CRB Composite ($CRB). Under this scenario, the price is now tracing out the right shoulder of a possible inverse head and shoulders pattern. Again this is highly speculative and is certainly not a prediction. I am merely offering a map for a possible outcome. Right now the KST is in a bearish mode and still overstretched on the upside. Since the price has also completed a small head and shoulders top and violated its February/March up trendline, the probability of further corrective action is high. Those January and February lows at around 155 now take on added significance.
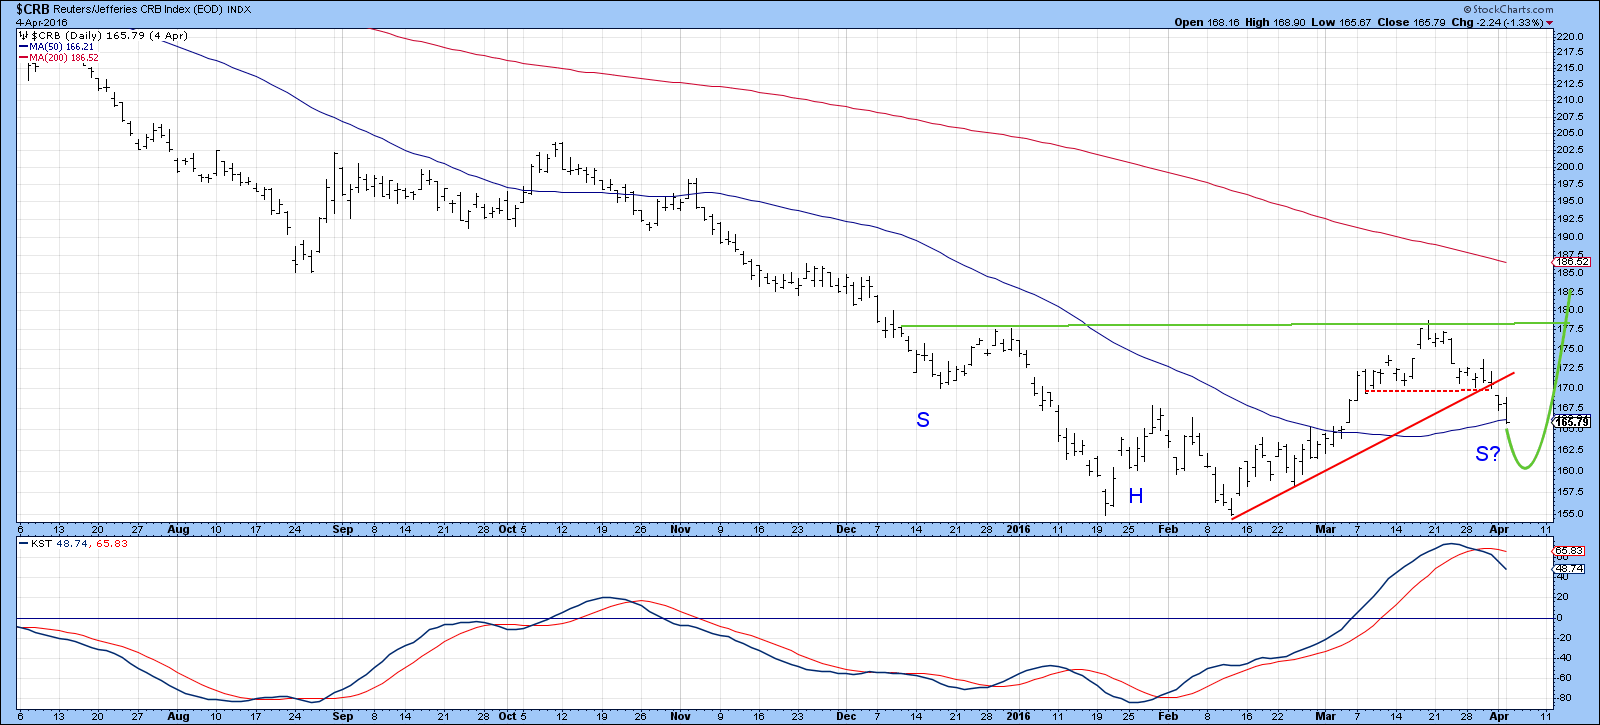

Chart 5
Relative commodity action favors metals and agriculture
If commodities are in the process of turning around, base metals could well be at the forefront of this move. Chart 6, for example, features the DB Base Metal Fund, the DBB. As you can see if you compare this chart to its predecessor, the metals ETF is much closer to its 200-day MA than the CRB Composite itself. The DBB is for sure still below its MA, but it would not take much in the form of strength to clear both the MA and the 2014-16 declining green trendline. The indicator in the middle panel is the relative strength line against the CRB Composite. It broke to the upside in February, rallied and then corrected. Now the KST in the bottom panel has started to turn up again, which suggests that the RS line is about to register a new high.
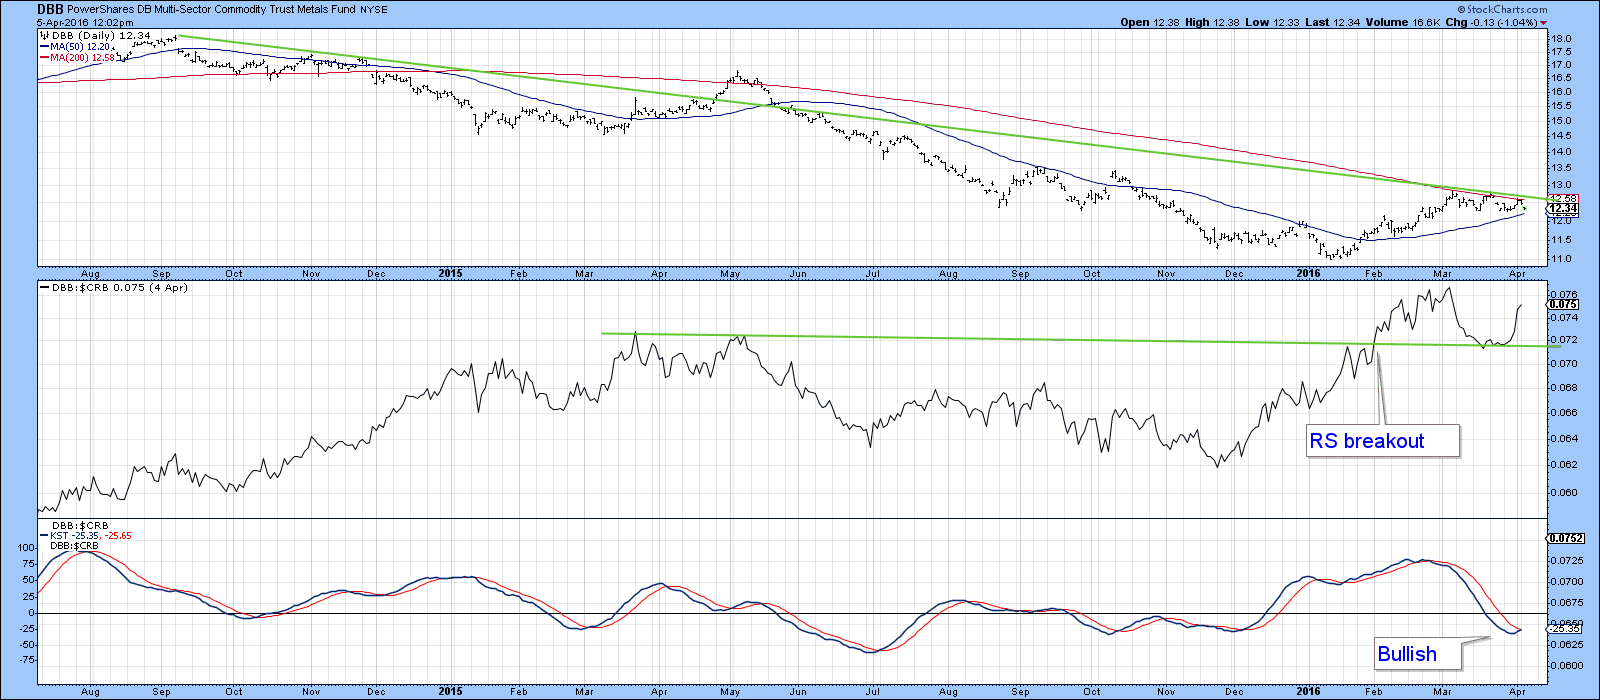

Chart 6
That compares to the DB Energy Fund (DBE), where you can see that the relative performance is in a long-term downtrend. In this instance, the KST for relative action in the bottom panel has just triggered a sell signal. It seems likely, that whatever direction commodity prices-in-general choose to take, metals will outperform energy in the period directly ahead.
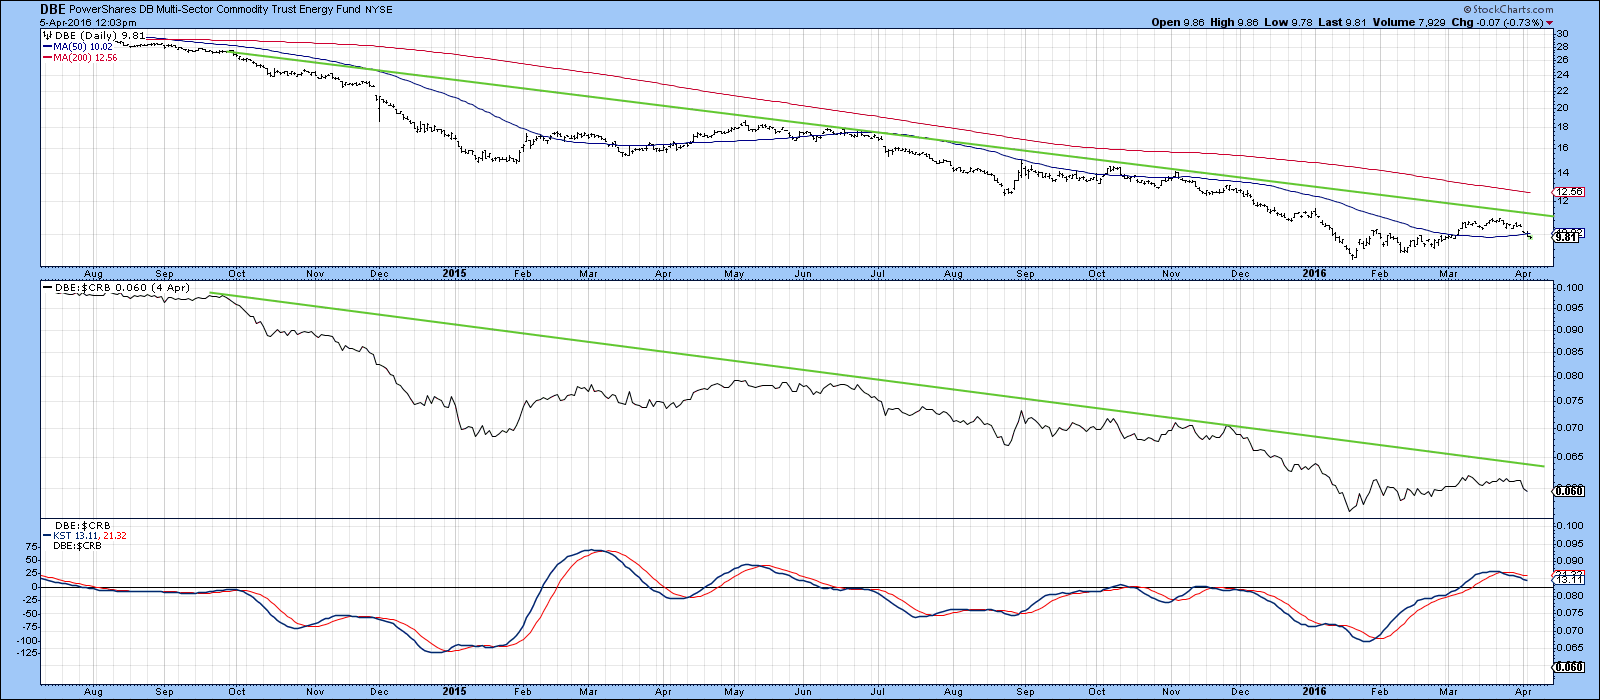
Chart 7
Finally, Chart 8 shows that the agricultural sector, as reflected by the DB Commodity Agriculture Fund, the DBA, is also in a downtrend, but one in which the possibility of a reversal is being held out. That possibility takes the form of a possible 9-month inverse-head-and-shoulders pattern. Note that there is huge resistance just below the $21 area where the 200-day MA and two converging trendlines are intersecting. Note that the RS line has been in an uptrend for a long time and broke out from a consolidation pattern last November. Now the RS KST, in the bottom window of the chart, has gone bullish again. This raises the possibility that the price may follow the fuchsia colored line and complete the reverse head and shoulders pattern.
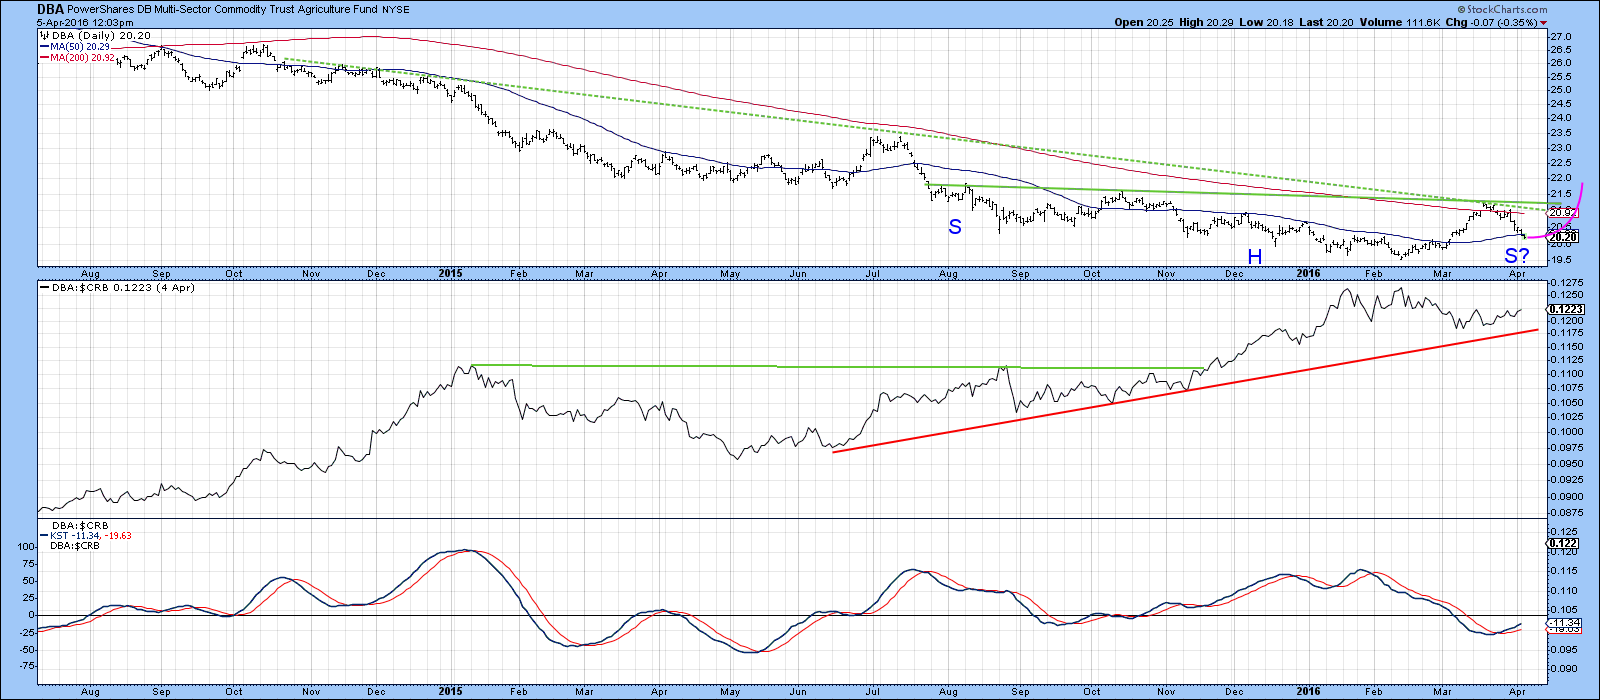
Chart 8
Stocks to continue to outperform commodities
Chart 9 compares the performance of the CRB Composite to that for the S&P. In the last few days, the indecisive ranging action has now been resolved on the downside, i.e. against commodities. Since the KST is also declining, it seems likely that commodities will continue to underperform stocks for a while.
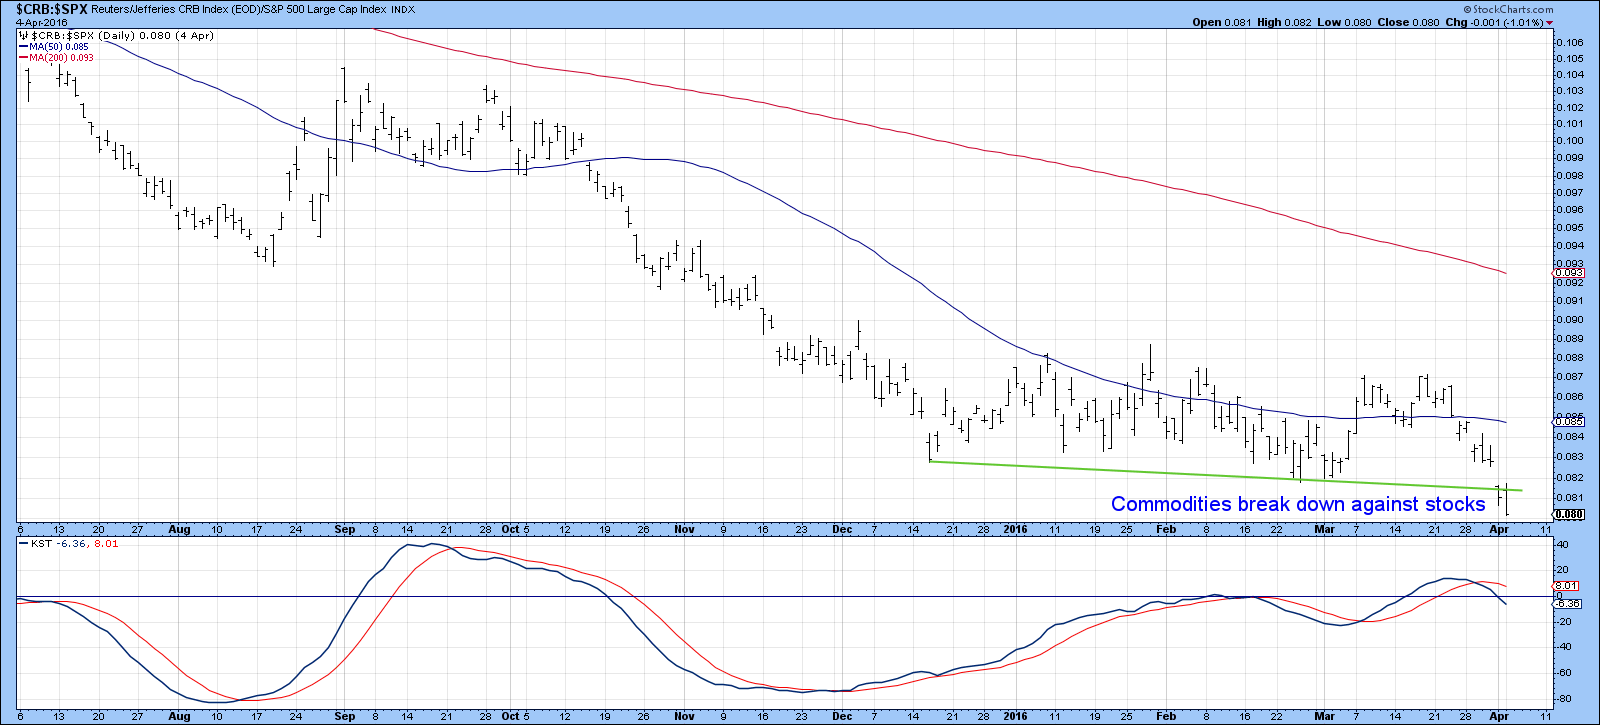
Chart 9
That extends a long-term trend as we can see from Chart 10. Note that major trend reversals in this relationship have been signaled when a trendline break in this relative line has confirmed three similar breaks for the ROC’s. We see a further setup of this nature developing at present, but none of the lines have yet been broken and the RS line itself is some way from a trendline violation. Until we can observe the four upside trendline penetrations I am assuming that commodities will continue to outperform stocks. It’s worth watching these indicators because their signals, when they come, have a high probability of being a game changer.
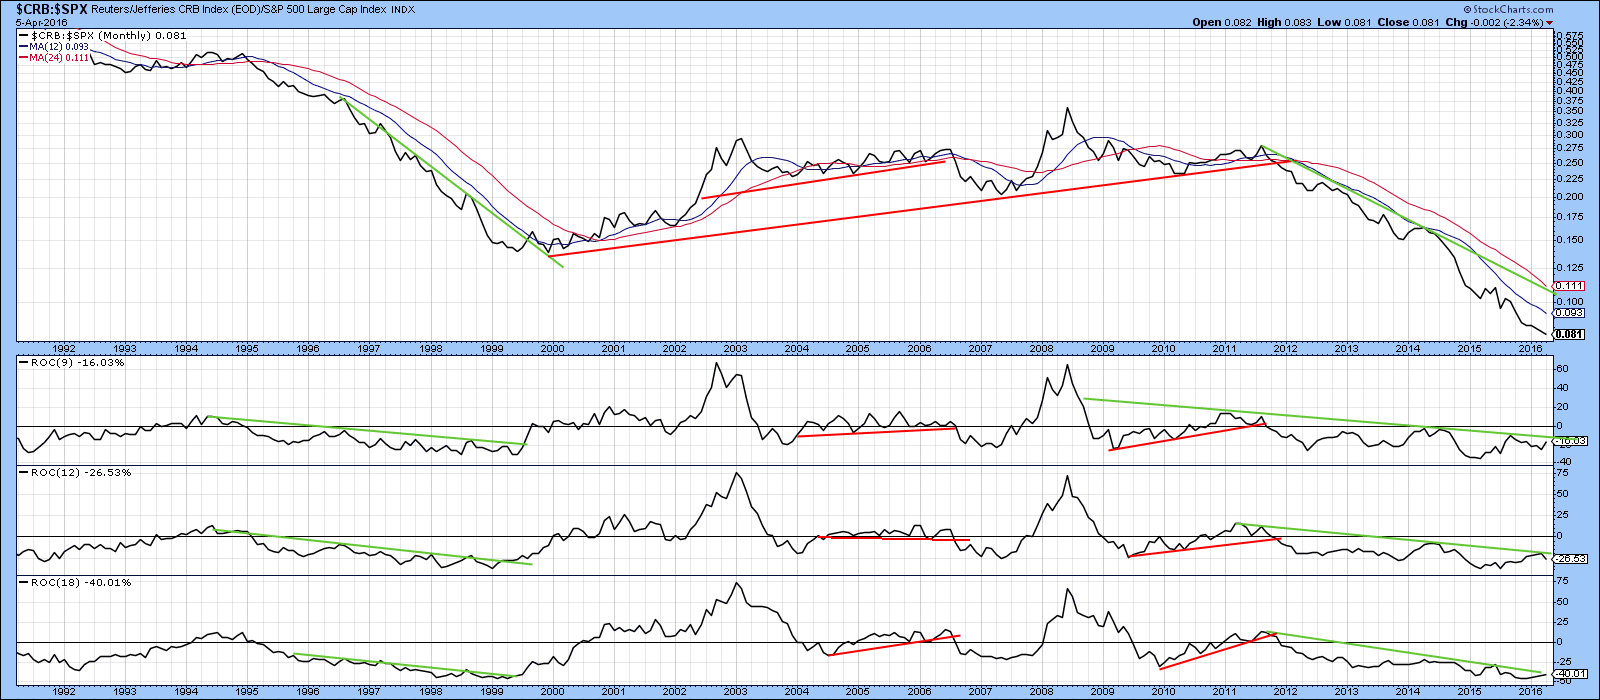
Chart 10
Good luck and good charting,
Martin J. Pring
The views expressed in this article are those of the author and do not necessarily reflect the position or opinion of Pring Turner Capital Group or its affiliates.