This chart was tweeted by our friend Jesse Fielder last night I thought it should be shared to everyone. It’s important to understand that the market can be held up and even hit new all time highs with the majority of stocks not following.
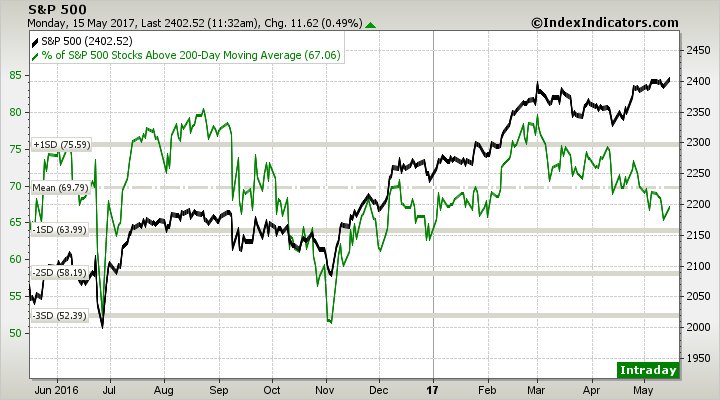
At one time the FANG stocks were seemingly the only stocks that were moving higher with the market 2 years ago. As the chart shows we are seeing a decrease in the percentage of stocks above their 200-day MA – currently at 67%, down from 80% just 2 and a half months ago. Oil stocks are playing a roll in this decrease as the underlying Crude and Brent prices have been under pressure since March but it does not account for the entire discrepancy in the chart.
The more concentrated money is in a limited number of stocks the greater the concern for a sell off that is quick and sharp. Now we could simply get some more internal rotation of money that lifts stocks in a more general sense higher but it is more likely that the market puts in a correction over the short-term… Which could be bought back up but that is a whole other discussion.
Here’s the chart…