In the note below from Chris Kimble he looks at the commodities index, oil market, and treasury yields. If all these markets turn at around the same time the overall inflation, global growth and interest rate narrative is thrown out the window.Check out the charts and explanations below.
Click here to visit Chris’s site for more great chart commentary.
In today’s 3-pack, we look at the commodities index, crude oil, and treasury yields. A major message to the markets could be underway.
Looking at the charts below, you will notice that all three assets/indicators touched up near their “Long-Term” Fibonacci retracement levels at the same time and could be creating reversal patterns. Could these indicators be sending a monster important message about global growth, inflation and where interest rates are headed next?
Note that a turn lower here by these indicators would be troublesome for the economy… and investors.
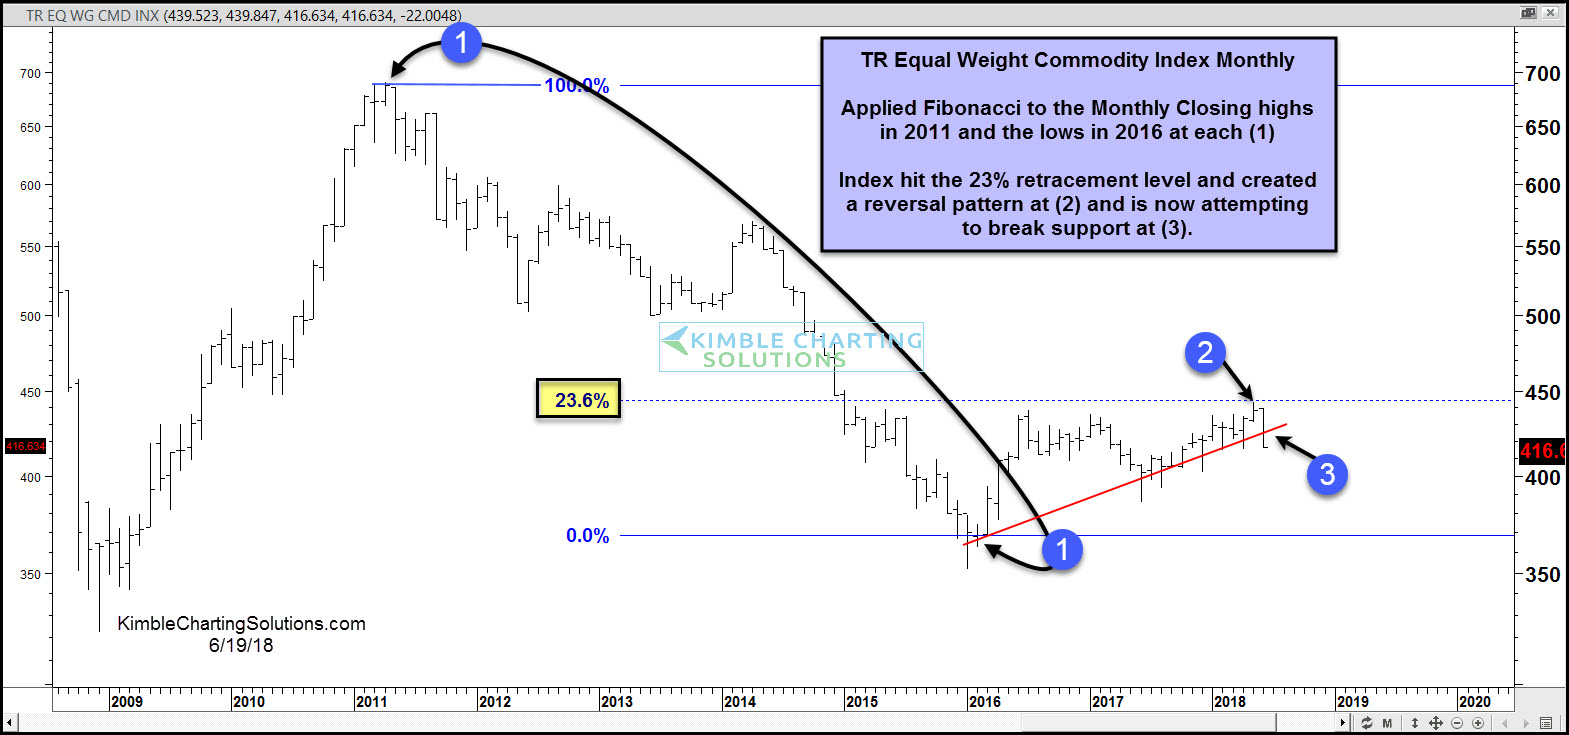
First, let’s look at the Equal Weighted Thomson Reuters Commodity Index. Using the monthly closing highs from 2011 and lows from 2016 (1), we can see that current price hit the 23.6% Fibonacci retracement level (2) and reversed hard. The reversal lower is now attempting to break support (3). Careful here!
Commodities Index “Monthly” Bar Chart
CLICK ON CHART TO ENLARGE
On to crude oil… once again, we used the monthly highs from 2016 and lows from 2011 (1) to calculate our Fibonacci retracement levels. Below you can see crude oil hit the 50% Fibonacci level (2) and reversed lower this month. That reversal has crude oil prices attempting to break an important uptrend line (3). Yikes.
Crude Oil “Monthly” Bar Chart

CLICK ON CHART TO ENLARGE
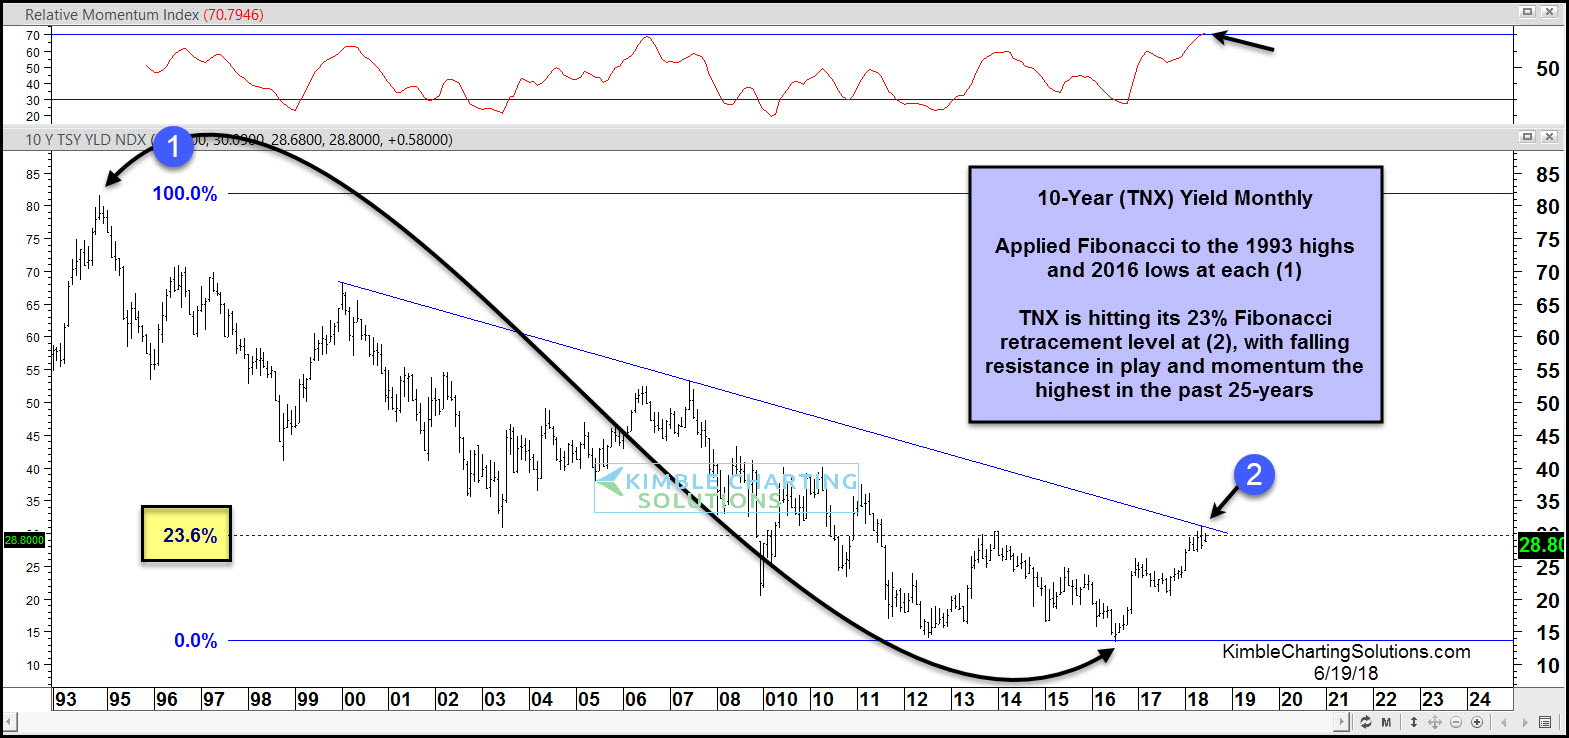
Lastly, interest rates are hitting an important resistance level that may keep inflation concerns in check. The chart below is of the 10-Year treasury yield (TNX).
Using the 1993 highs and 2016 lows for yields (1), we can once again calculate our Fibonacci retracement levels. Here we see yields hitting the 23.6% Fibonacci level at falling trend resistance (2). This dual resistance may be hard to surmount over the near-term, especially as momentum hit its highest level in 25 years!
10-Year Treasury Yield “Monthly” Bar Chart
CLICK ON CHART TO ENLARGE