Steve Penny, Publisher of the SilverChartist Report, joins us to share a number of key charts on the US Dollar, S&P 500, Gold:Dow ratio, Uranium, and Uranium Miners. (all posted below so you can follow along).
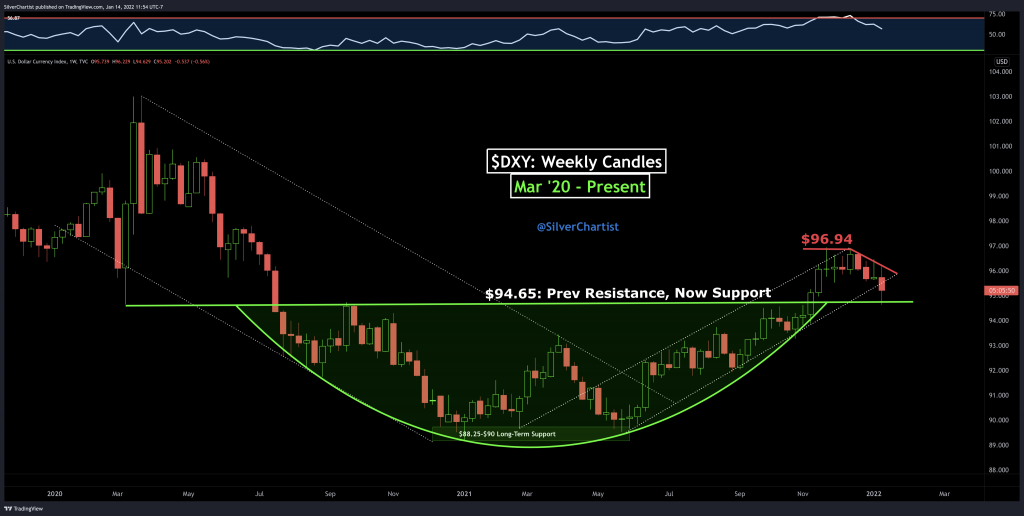
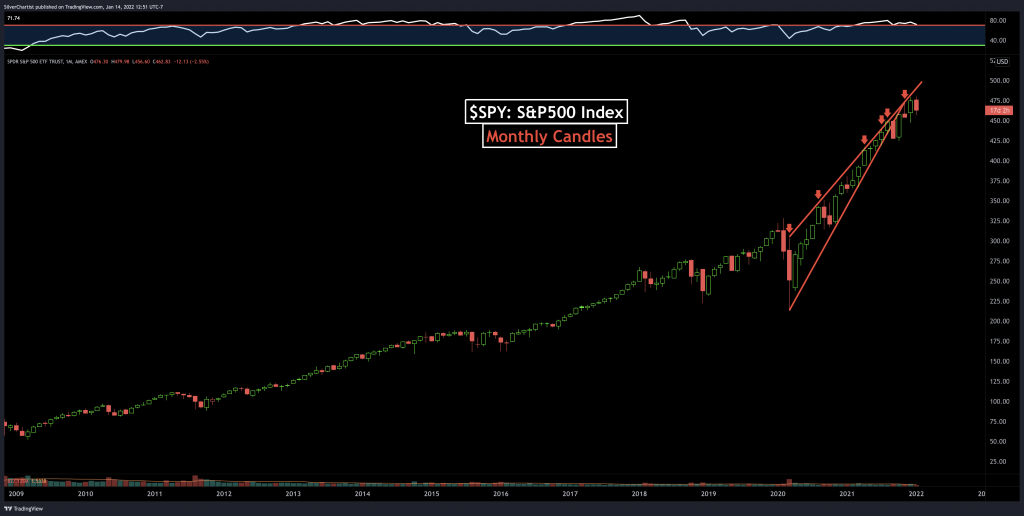
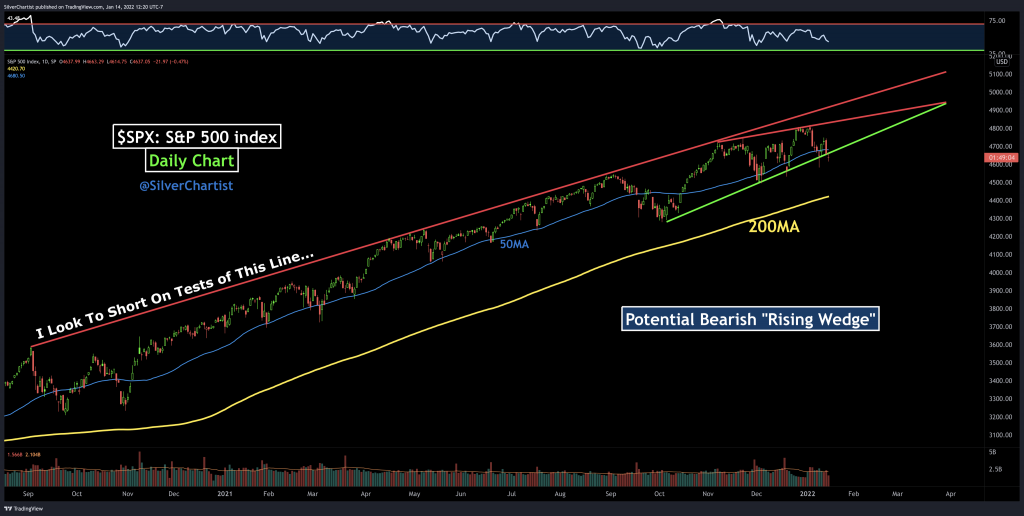
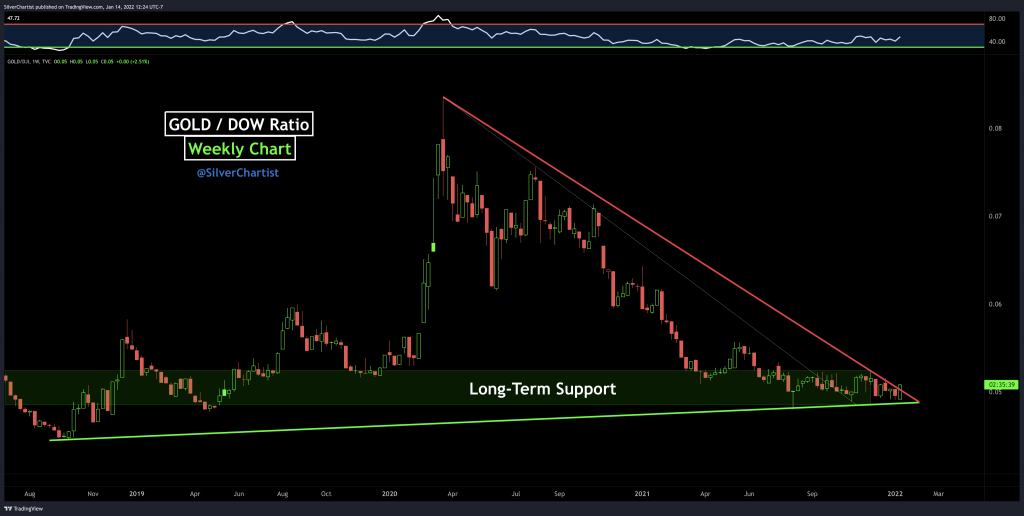
We start off with getting Steve’s insights on both the US dollar chart and discuss how it doesn’t necessarily need to correlate to the directional movements in gold, but instead is merely a headwind or tailwind. Next, we review the longer-term bullish chart of the S&P 500 (SPX) and how it may be close to key resistance, which could send it correcting down to the 200 day moving average. We then turn our attention to the gold : Dow ratio chart but also note how historically undervalued the whole commodities sector still is compared to general equities or most other asset classes.
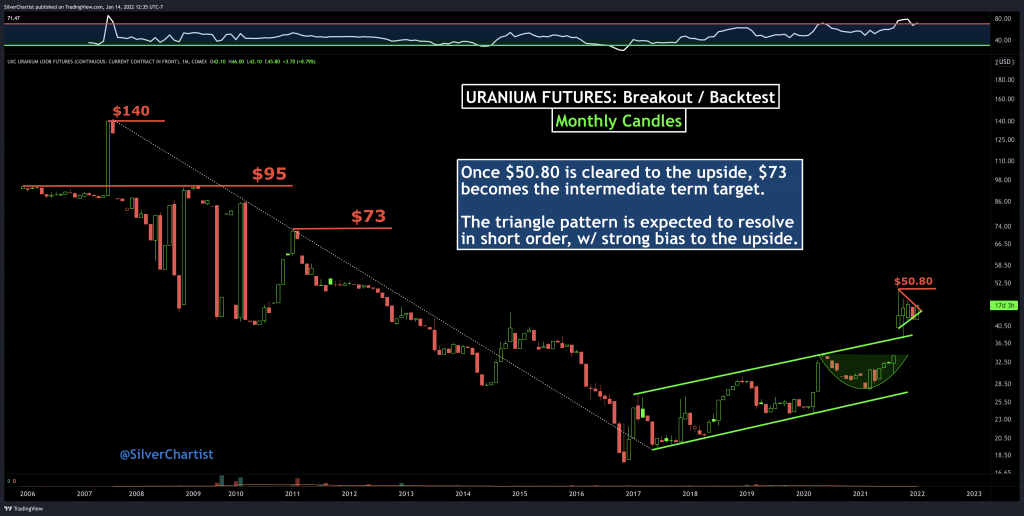
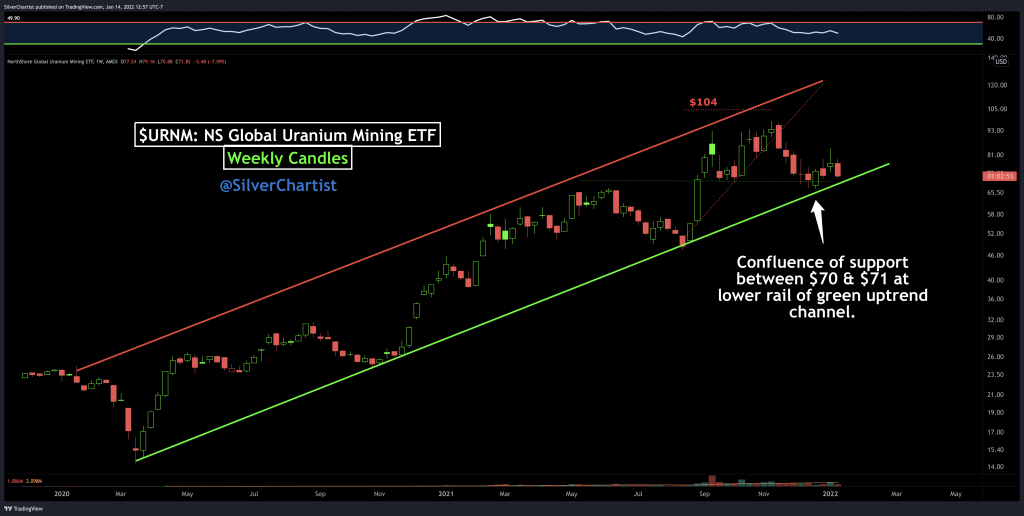
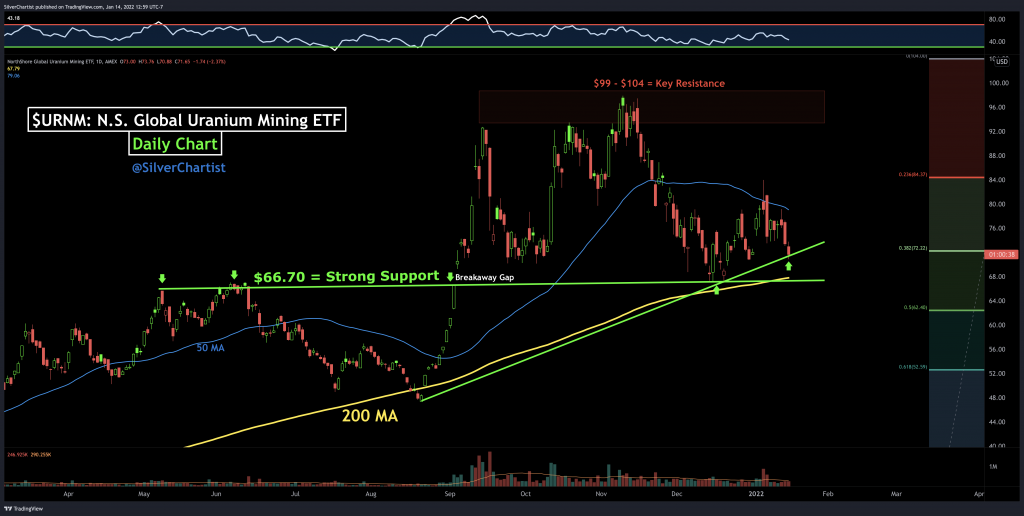
Steve then breaks down the uranium price chart, where he sees plenty of upside left in the medium-term for it to make a measured move up to overhead resistance at $73 per pound. We wrap up with a look at the and the NS Global Uranium Mining ETF (URNM), where Steve believes the outperformance of the stocks to the underlying metal over the last 2 years was just a reversion to the mean, and that the recent corrective move to trendline support is probabilistically just building the base for the next move higher in uranium equities.
Click here to visit the SilverChartist website and sign up for Steve’s free email list. That is the best way to get a handle on Steve’s research.