
Excelsior Prosperity w/ Shad Marquitz – 04/07/2024
The Precious Metals Bull Can No Longer Be Ignored.
{Neither can the next leg of the Oil and Oil stocks bull market, or the next move higher in Copper and the larger Copper stocks, or the continued multi-year run that Uranium and the Uranium stocks are on… but more on that later.}
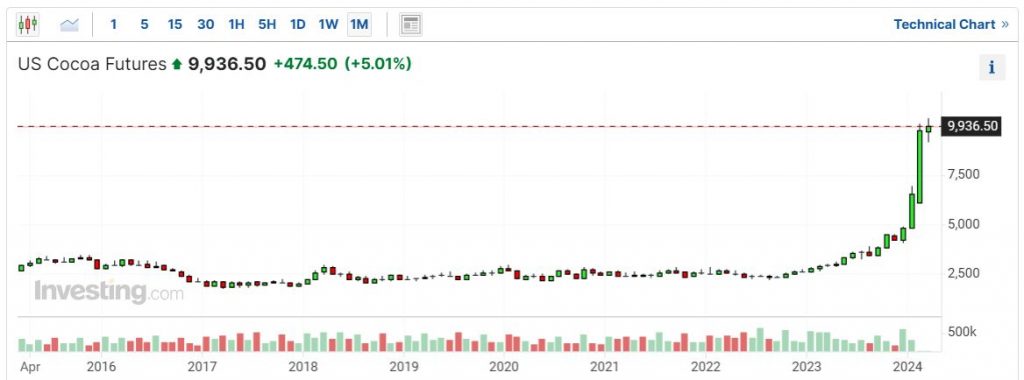
This last week in the market, we’d have to give the most impressive move in commodities to Cocoa. Cocoa futures have been on an absolute tear higher for the last year, and have only kept surging higher and higher over the last few weeks, and making headlines. (By the way – I hate to see that personally, as chocoholic anticipating higher future prices in my already expensive small batch chocolate bars…)

However, with regards to the rest of the commodities complex, it was Gold, Silver, and the Precious Metals stocks that were finally getting their moment in the sun.
We had breakouts to new daily and weekly charts across the board in the precious metals complex, and finally some follow through momentum in the PM space, after bottoming in late February. Let’s take a look at some of the key pricing charts, which resolved nicely for the balance of the week.
- Most readers here will know there was just a “Special Alert” put out earlier in the week on this channel titled: “Silver And The Silver Stocks Are Finally Starting To Outperform”
https://excelsiorprosperity.substack.com/p/special-alert-silver-and-the-silver
In that article on Wednesday, we were looking at new intra-week highs on the daily charts, and the corresponding significance to where the weekly charts were at that point in time. Let’s now look into how things resolved since then, where we got some anticipated backing and filling sector pullbacks in pricing on Thursday, and then another surge up on Friday, to end the day and the week on a really high note. On the weekly charts we’re going to review today, there are some nice long bullish candles breaking up to new chart levels. (isn’t that refreshing environment from where we’ve been the last few years, or even where we were just 6 weeks ago?)
I’m going to kick off things off again with Silver and the silver stocks in this article, since so many prior articles just squeezed it in (in fairness, it wasn’t doing much at that time). Also, there is overwhelmingly so much industry focus on gold and the gold stocks as the key precious metal and monetary metal. Silver definitely earned it’s spot though, in pole position for this week’s article, by finally breaking out.
Silver had a stellar week, opening the futures market on Monday at $25.23 and then closing on Friday at $27.50. I stated this earlier in the week on that Special Alert, but it deserves reiterating here, once again. For this silver pricing chart, a $2+ weekly move higher is a really BIG Move! This also looks like a good old fashioned short squeeze, (but it’s unlikely that many tears will be shed for the shorts).
- The last time we saw a move this big was last November to the downside, where prices fell by about $3+ from $26 to below $23 that week. We should be looking to see if things unfold in a similar but inverse fashion to that move. After the November pricing crash, the next week had a counter-trend rally up, but then a slow resolution lower in the weeks and months to come. So if we just had a large $2+ rally in silver this last week, then it would not be a surprise to see a counter-trend pullback lower, and then a resolution to even higher levels in the weeks and months to come. If we see an extension even higher next week on another bullish candle or series of them continuing to break even higher, then even better. Regardless, a consolidation of last week’s surge higher would not be a surprise, and would be healthy market action, but if silver just wants to keep rocking higher, I don’t think that is going to offend any of the readers here.

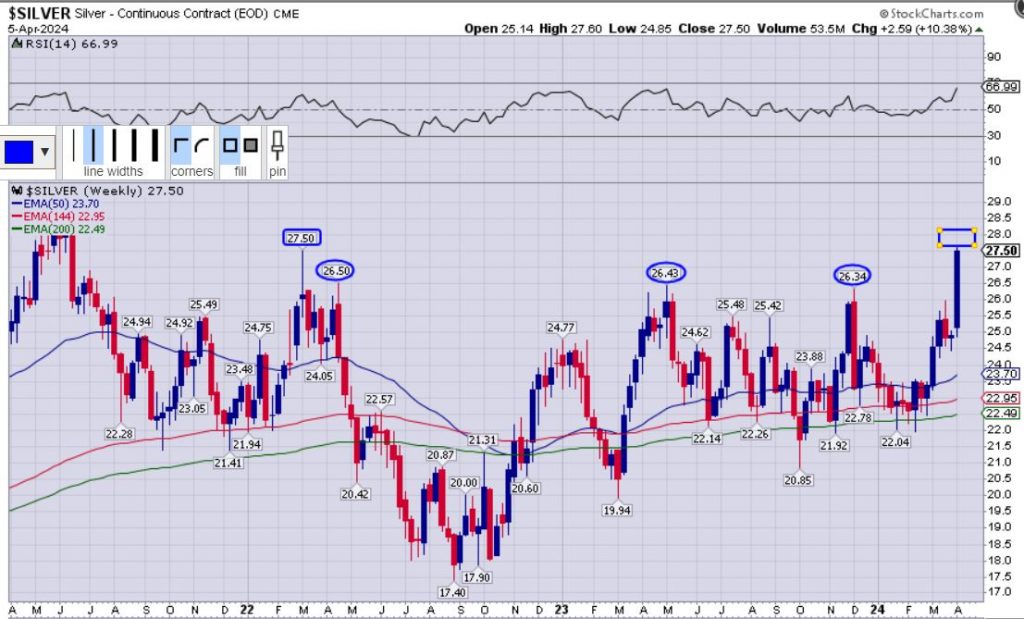
It is also important to highlight on this silver weekly chart, that this close Friday at $27.50 definitively confirmed the breakout and eclipsed the 3 prior peaks we discussed in previous articles (at $26.50, $26.43, and $26.34 – seen in blue ellipses).
What is also so uncanny (or is it?), is to see the pricing level close at precisely the same level as the prior intraweek high from early 2022 at $27.50. Painting the tape in this manner will allow for potential “double top” speculation from the bears, but note the difference between the 2 weekly candles (it’s night and day). The prior March 2022 candle that hit $27.50, had a long wick where fell pricing all the way down from the high to close near the bottom of the range, in an indecision candle. The latter candle from his last week was a full-bodied candle closing at the very top of the range with hardly any wick. We’ve seen a couple of these over the last year and they were followed by a few more bullish weekly candles, so again, if we do see that then awesome. Regardless of whether we get a corrective week or a bullish extension week to come, the point is the same: Silver was a champ this last week, and broke out to a new intermediate-term high, and that is what etched on the chart moving forward.
- Speaking of silver… On Thursday this last week, I had a great discussion, over at the KE Report, with Peter Krauth, editor of Silver Stock Investor, and author of the book, “The Great Silver Bull.” For those investors interested in silver and the silver stocks, Peter is one of the big voices in the sector and one of the more well-informed analysts covering this sector. I’d recommend checking out this interview on both the fundamental and technical factors at work in physical silver, the paper silver markets and ETFs, supply/demand metrics, and of course we get into the silver stocks and what companies are on his radar.
- Peter Krauth – Silver Fundamentals And Silver Stocks Setting Up For A Sustained Move Higher – Apr 4, 2024
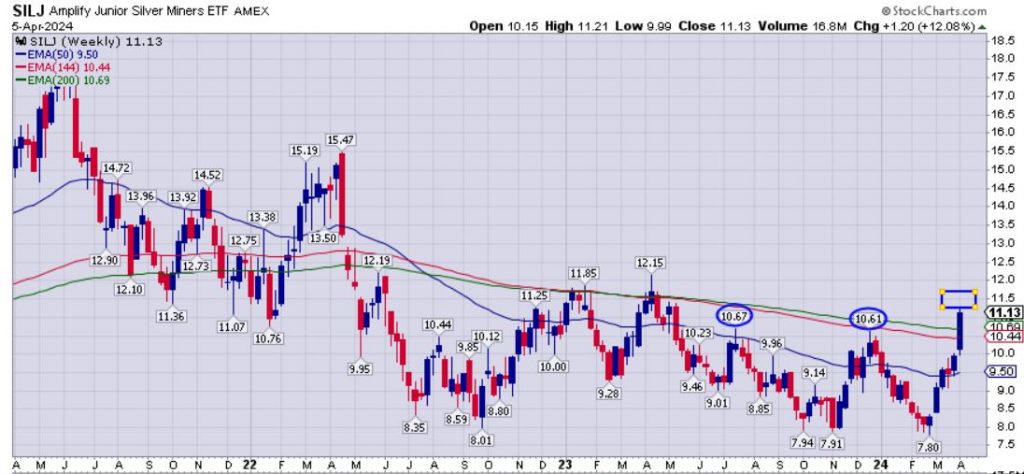
Now, let’s take a look at the silver stocks via the (SILJ) Amplify Junior Silver Miners chart.
What is so important when we look at the weekly chart is that SILJ closed the week at $11.13, where it eclipsed decisively the 2 prior peaks at $10.67 and $10.61, and the 144-week EMA at $10.44 and even more importantly the 200-week EMA at $10.69. SILJ has been leading the other 3 primary PM ETFs (GDX, GDXJ, and SIL) higher since bottoming in late February through present. This is the kind of bullish action we want to see in this sector, where silver breaks out and silver equities outperform the gold equities.

As I mentioned earlier in the week when covering this same point, that isn’t to take anything away from the gold ETFs either. The gold EFTs have been outperforming most other market sectors for over a month now, and have been putting in some important new levels on the weekly charts as well.
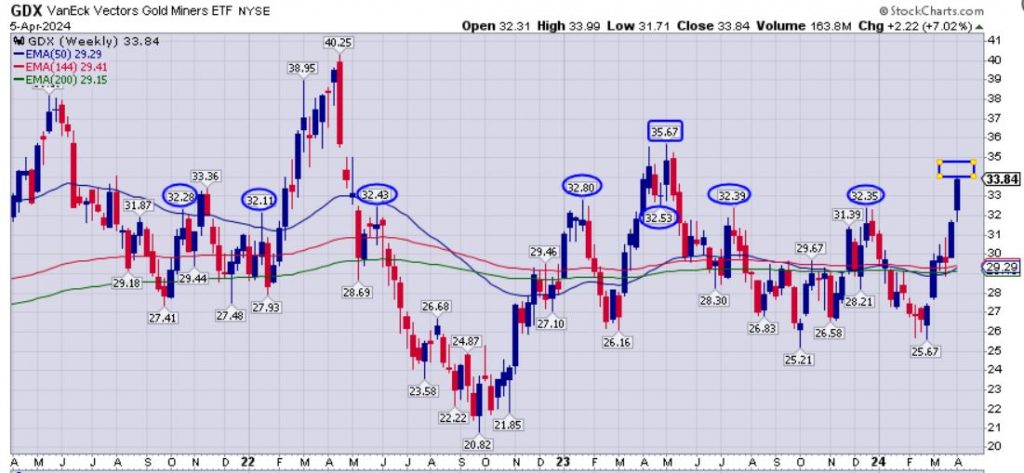
Just look at the close on Friday in (GDX) at $33.84, popping up above that slew of prior peaks and troughs in the $32’s. That hasn’t happened since last May when GDX got up to $35.67, and this makes that prior peak and lateral price action the next overhead resistance to clear. We also see pricing well above the 3 key exponential moving averages on the chart below, which is definitely a bullish posture. At this point the moving averages are all very close together, but we are starting to see the confirming signal where the 50-week EMA (blue line) broke up above the 200-week EMA (green line), and it is approaching the 144-week EMA (red line). And even more bullish signal will be when the shorter duration EMAs are stacked on top of the longer duration EMAs, and when they are all starting to slope upwards, so we’ll be looking for that in the weeks and months to come.

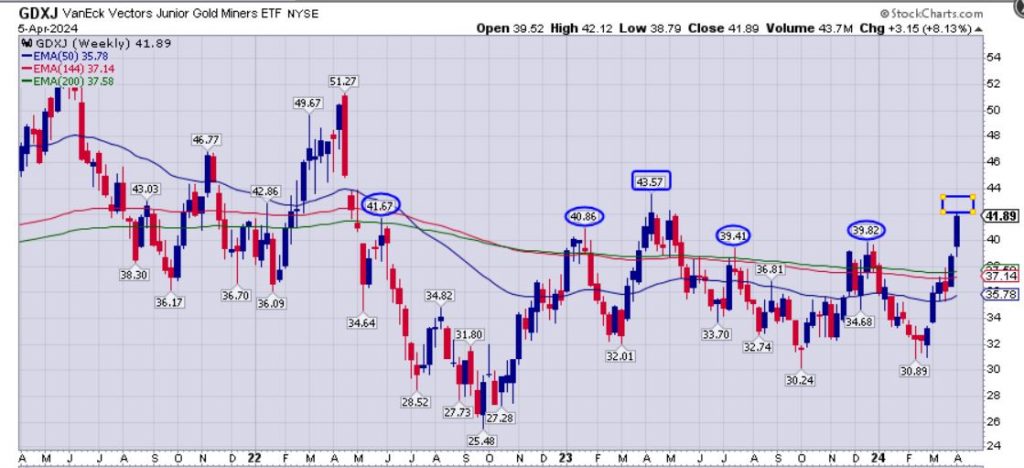
(GDXJ) closed Friday at $41.89 and it pierced through the pricing level resistance of now 4 prior peaks $41.67, $40.86, $39.41, and $39.82 respectively, which again is more bullish breakout action for the gold equities. There are still some other prior peaks at $42.86, and $43.03 to work through, but the big resistance line in the sand for GDXJ is going to be taking out that $43.57 peak from last April. It’s definitely getting within range, especially if the mining stocks keep getting inflows of new capital. It has more work to do with regards to the exponential moving averages, where the 50-week EMA is still below the 144-week and 200-week EMA, but at least is finally starting to slope slightly upwards.

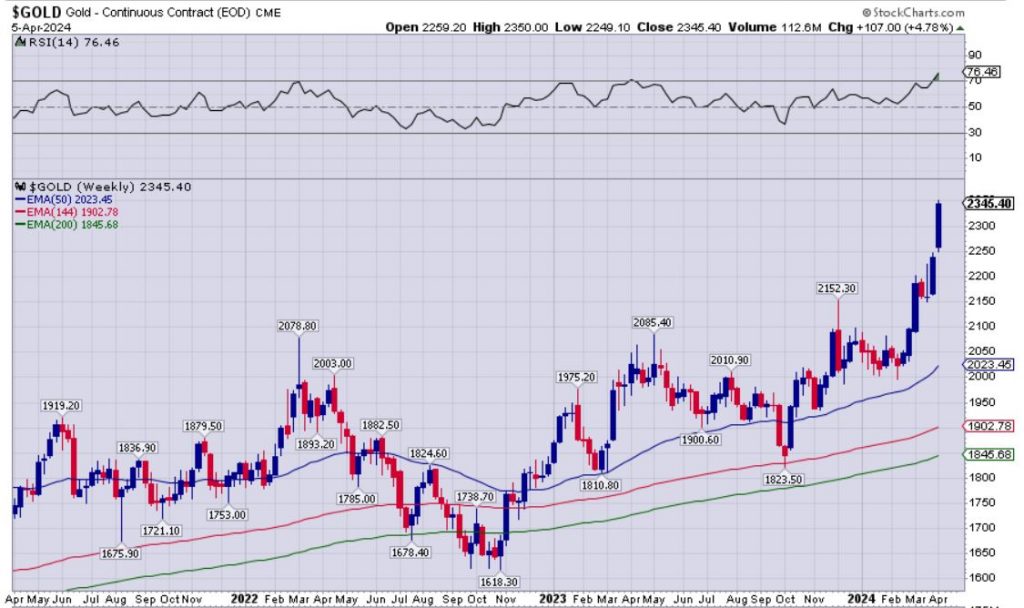
And then there is Gold… blasting up to close Friday at $2345.40 to a new all-time daily and weekly close. (gotta love that 2-3-4-5 number) This is just stellar action in gold, as it keeps breaking out, and not too shabby at all for the “Boomer Rocks.” 🙂

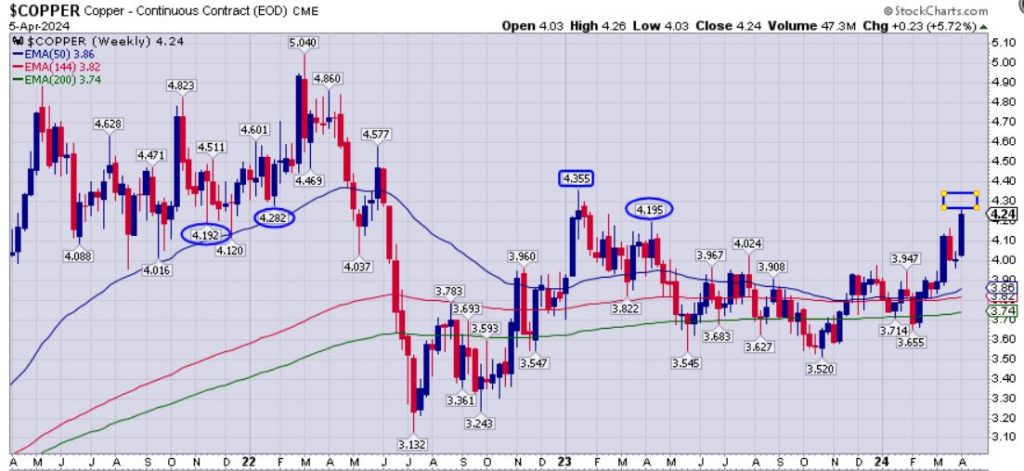
Pivoting over to the good doctor: We see that Dr Copper is still making steady progress to the upside, closing the week at $4.24, decisively above all 3 weekly EMAs. More importantly that weekly close is also above the lateral pricing resistance from the prior trough at $4.192 back in late 2021 and prior peak at $4.195 from August of 2023; but still slightly below the trough at $4.282 from January 2022 (all noted with blue ellipses on the chart below). The next key resistance to clear is that January peak at $4.355, and then after that there is a big resistance zone in the $4.50’s-$4.60’s. The ultimate prize is the high-water mark at $5.04 back in March of 2022, but there is a lot of work to do first. The key is that steady progress has been made, and this last week was another key important close for the copper price chart.

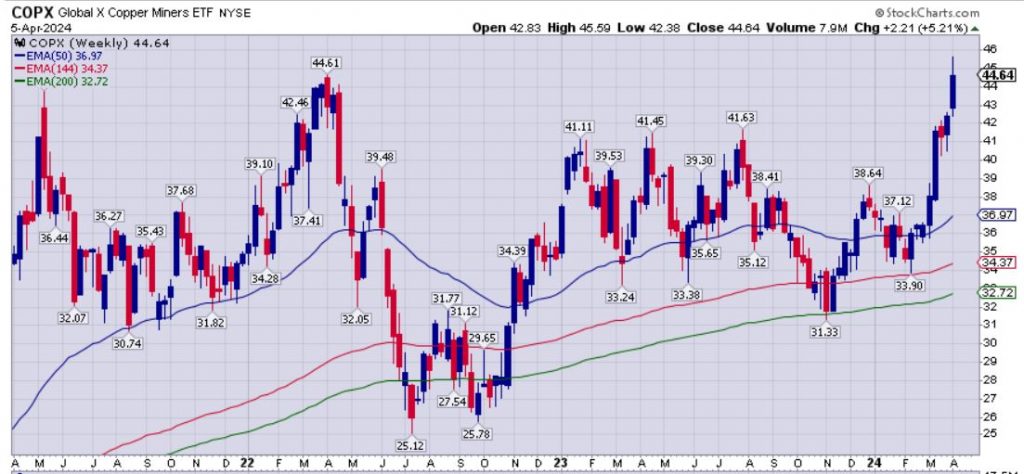
As for the copper stocks, there are a few key ETFs to follow now, with advent of a new Sprott Copper Miners ETF (COPP), the new I-Shares Copper And Mining ETF (ICOP), but I’m going to stick with the more established and widely followed Global X Copper Miners ETF (COPX) and the Sprott Junior Copper Miners ETF (COPJ). COPX and COPJ are very much to copper equities what GDX and GDXJ are to gold equities. Now… maybe over time COPP or ICOP will dethrone COPX, so we’ll be watching to see which one garners the most investor interest, liquidity, and performs best.
On the COPX chart below, this was also a significant week, because a new all-time weekly high of $44.64 was logged on the chart, eclipsing the March 2022 high of $44.61. That is bullish action, and shows more momentum coming into the copper seniors. There is no clear overhead resistance now, as we are in blue sky territory, but one could look to Fibonacci extensions for a few ideas.
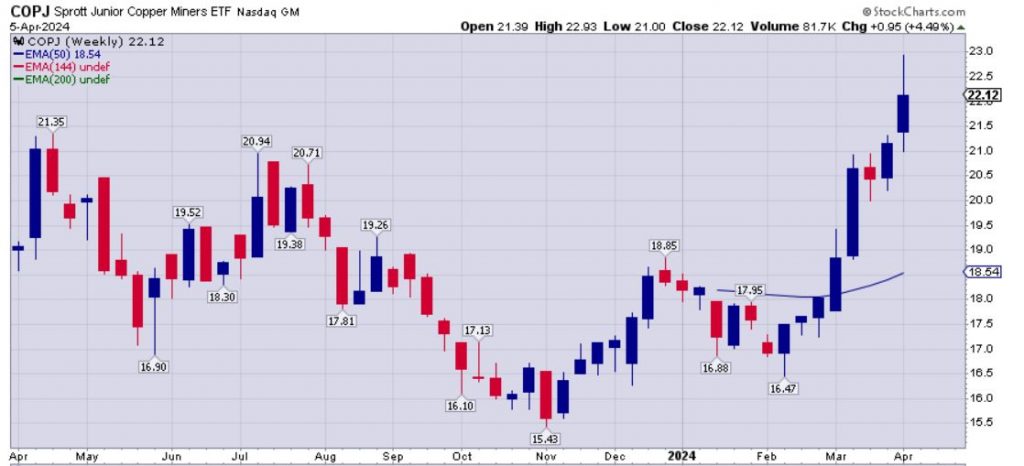
On the COPJ weekly chart below, we also saw a new all-time weekly high at $22.12, but in fairness this ETF has only been around a year. Regardless this week’s closes definitively eclipsed all of last years peaks, and that is bull action for the copper stocks in this ETF (which are actually more of the mid-tiers than real juniors). This pricing action bodes well for these slightly more speculative copper equities getting a strong bid from investors, and makes me happy as a shareholder of COPJ (for full disclosure).

While copper is an important “Energy Metal” and “Strategic Metal” necessary for the global energy transition underway, investors have to look no further than legacy energy like oil and the oil stocks, to see another commodity sector really breaking out in a constructive way.
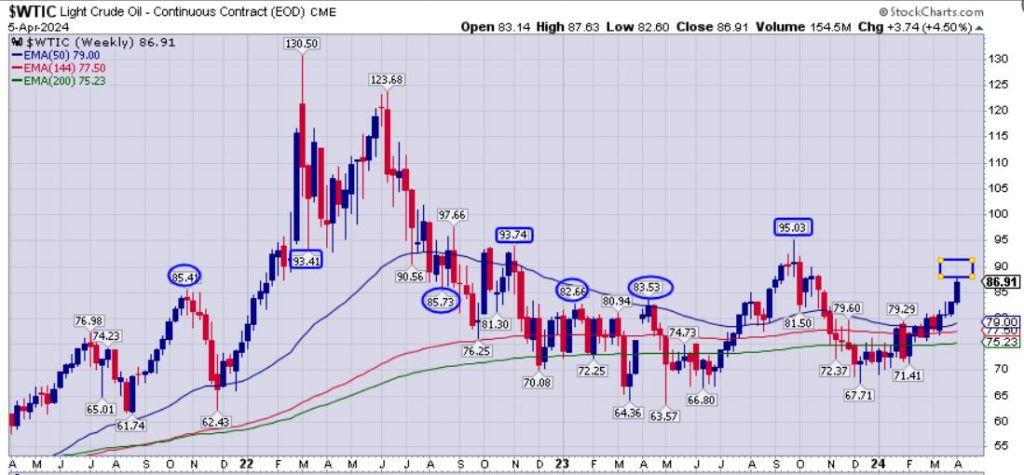
The Light Crude Oil futures contract (WTIC) broke out to a new intermediate-term high closing the week at $86.91, and definitively eclipsing prior peaks and troughs at $85.41, %85.73, $82.66, and $83.53 respectively (noted by the blue ellipses on the chart below). Next overhead resistance comes in at those lateral pricing levels from the $93.41 trough back in March of 2022, and $93.74 peak from October of 2022, and then the big resistance line to cross will be that $95.03 peak from September of 2023. (future resistance levels noted by the blue rectangles on the chart below).

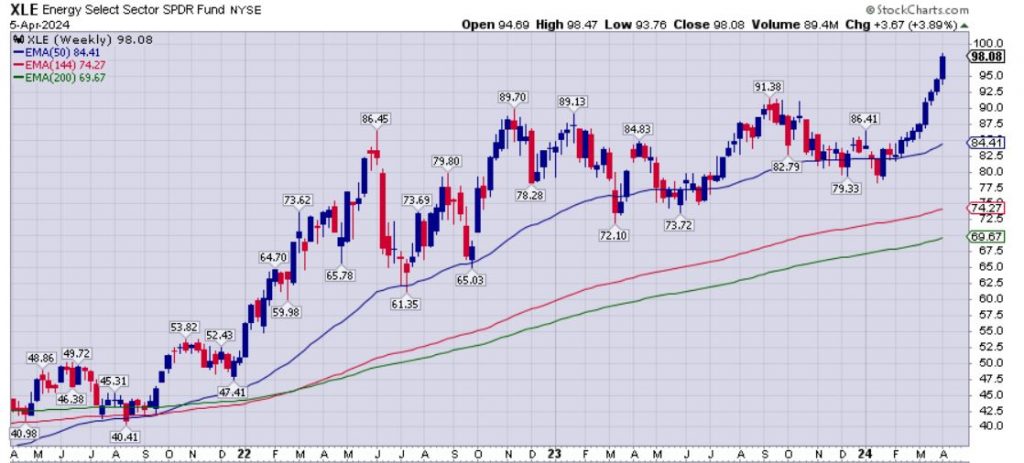
With regards to oil stocks, they really deserve a deeper dive, which maybe I’ll do mid-week this next week to be able to dive into the sector a little bit more granularly looking across the spectrum of oil and gas stocks. However, for this update, let’s at least celebrate the continued breakout to new all-time daily and weekly highs in the Energy Sector SPDR Fund (XLE), comprised of the larger oil and gas producers. XLE closed the week at $98.08 – what a rally!

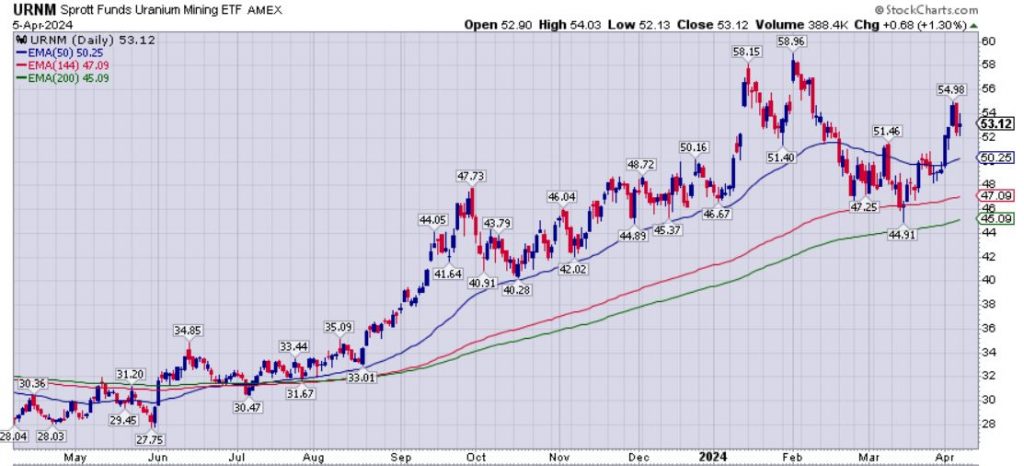
Let’s also check in briefly with the best indicator for uranium equities, the Sprott Funds Uranium Mining ETF (URNM). We’ve mentioned in the past the importance of the 50-day EMA, which has been a magnet for pricing. The 50-day EMA went from solid support for almost a year, but then starting in February had shifted back over to resistance (where we saw the 144-day EMA come in as support). URNM closed the week at $53.12 in a slightly bullish indecision candle, but still above the 50-day EMA currently at $50.22 (blue line), which should offer future support. For resistance, we’ll first want to see the recent peak at $54.98 surpassed, and then ultimately the prior peaks from late January at $58.15 and early February at $58.96 cleared definitively for more bullish momentum to come back into the sector.
That’s it for this week, and stay tuned for mid-week updates on the commodities and resource stocks.
Thanks for reading and may you have prosperity in your trading and in life!
– Shad