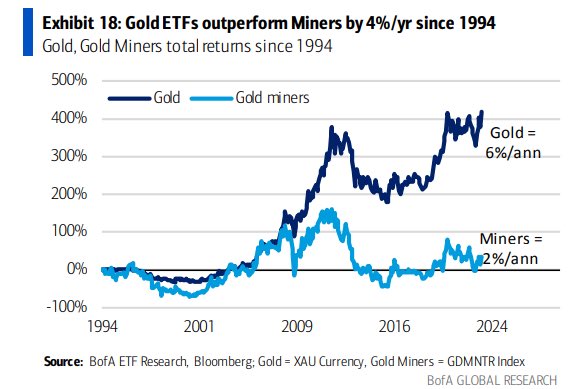
Below is an email Robert Sinn, AKA Goldfinger send out to his subscribers this morning. As the title states it’s a rundown of Newmont’s earnings. There are some very interesting points he isolates within these earnings plus the chart at the bottom comparing gold’s returns to the miners since 1994 that jumped out to me. Please let us know your thoughts and what jumps out to you.
A big thanks to Robert for giving me the go ahead to post this for all of you.
Be sure to stay up to date with Robert on Twitter (click here) and on CEO.ca (click here).
… Here’s the email …
Newmont Corporation (NYSE:NEM) managed to engineer a better than expected quarterly earnings bottom line despite lower than expected gold production. Newmont generated $481 million of cash from continuing operations while reporting negative $45 million of free cash flow. Free cash flow was impacted by lower production volumes, timing of working capital changes and higher capital spend.
- AISC (all-in sustaining cost) of production from its Nevada operation (NGM in combination with Barrick) rose to US$1,405 per ounce.
- Once again Newmont is pointing to a back half weighted year with 55% of its annual production coming in the 2nd half of 2023.
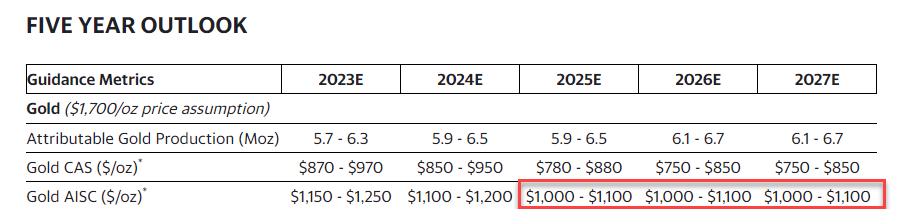
- Newmont sees AISC moderating to a range of $1,000-$1,100 per ounce and staying flat through 2027