
Chris on Bernanke the Blogger

A story some of you have no doubt heard today involves the immediate predecessor to Fed Chair Yellen taking to the blogosphere in an attempt to start sanitizing his legacy. Chris has a few choice words for this charade; and even more so for the REAL creator of our current bubble world, the mad scientist Alan Greenspan.
Click download link to listen on this device: Download Show
Muchas gracias!
On this guy, what baffles me are the people who still pay the apparently $0.25mn price tag to have him speak at conference or have him over for dinner.
That some hedge fund guys paid that money to have him at dinner JUST AFTER he left the Fed, I kinda understand. But that some people still did it almost a year after he left is wayyyyyyyyyy beyond my understanding.
Chris, I think you nailed it when mentioning that B.B wants to sanitize his image and rehabilitates it a little bit.
GL to all investing/trading.
LPG
Ben Bernanke was dirty.
The first time he lowered interest rates he leaked it to wall street.That was Thursday afternoon and the market rallied over 300 points. Friday morning pre market he announced the lowering of the interest rate and the market rallied over 300 points pre market.Of course the rally continued when the market open.All those in the know had a nice couple of days compliments of Mr Bernanke.
It’s not just retirees that are losing out how many working class stiffs get a raise every year that compensates them for the increased cost of living, none that I know of and that is in a union environment where workers typically get more of an increase per year then most. DT
I think its great that you’ve stepped in to help out while the guys are away, Chris. Thanks for all you are doing!
About your commentary though…….I don’t feel as you do about Ben Bernanke. Probably you have guessed I think he did what needed to be done under the difficult circumstances. And were we not all surprised that the worst of predicted outcomes never materialized?
It just tells me the Fed negotiated their way through the past few years with skill considering we were all so certain at varying times the wheels were about to come off the cart altogether.
All that aside, please go and review the long term chart of 10 year rates going back a couple hundred years and try to reconcile that with what is now taking place.
Rates have been in relentless decline on a cyclical basis for a few centuries. There is not therefore any justification in blaming the Federal Reserve or Ben for merely being the guy who was at the helm during termination point when the zero bound finally came into focus.
What that chart tells us (I have posted it many times by the way) is that there are other forces at play in the markets that are dictating the general declining rate trend. I am referring to the major trend across all those years rather than the spikes within the larger decline.
So, for example, it is not reasonable that the Fed be blamed for the dozens of decades prior to its existence where the trend actually first began and it is equally improbable to my mind they should be blamed for the past 100 years where that part of the trend was merely a continuation of an established falling line.
I realize I have made this comment before and it won’t convince anyone who already has their mind made up…i am just saying lets keep our minds open and look at the facts.
WHY have rates been falling for such a long time? Was it not inevitable based on the chart that we would have arrived here anyway no matter who was doing the rate setting? Sure seems like it to me.
We need to dig deeper to understand what happened to us economically (in the big picture) along the path from early industrialization to the high technology era that led us here in the first place and finally brought us to this conclusion.
My assertion is this….it has little to do with either the Fed or Central Banks.
Very good comments, Bird —
Thanks Chris. I have linked the chart (in a post below) that I think is important to this discussion. All that really matters from my standpoint is the chart pattern itself. It was inevitable we were going to see the Zero Bound when viewed from this perspective. So the Fed is pretty much off the hook. What I want to know is what is behind the rate cycle that causes the peaks and valleys. It cannot be QE or the issuance of Fiat money for example because we easily observe the cycle at work even during a time when we were on a gold standard. I think it has to do with a whole set of variables such as industrialization, widespread and easy availability of food, increasing leisure, savings rates and efficiencies as a few examples. But I don’t have any easy answers to offer. For now I will just respect the chart and do my best to work within the pattern that has developed. If you want to really bend your mind one day though….try projecting that chart out for the next hundred years. Wow!!
You don’t get it Birdman. Your like the cancer patient that goes to the doctor and the doctor prescribes an implantable medicine bag.Two years after the patient dies,the doctor is indicted for getting a kick back on the drug going into the bag.
The Federal Reserve is connected at the hip with the Black Budget.
Their are no coinsedences.
Everything happens for a reason.
Case in point:
Look at the deposits of the Federal Bank of Miami during the Cocaine heyday.
John…..he does not get the BLACK BUDGET.
Most do not get or have they heard of the BLACK BUDGET……YET…
just ask them if they have heard or read about the BLACK BUDGET
OK Jerry, you just repeated the same thing three times and as usual it has nothing to do with the conversation. Maybe time for a nappy or something?
WARNING NO.4
Bird, you need to do some homework as usual.
BIRD……QUESTION………..have you read the BLACK BUDGET, and if you have, tell us about it.
Jerry, if you need attention that bad then go get a haircut. The stylist will no doubt give a damn about black budgets and you will get her full time attention as she shampoos your scalp.
Over here though, you are pretty much wasting precious air. Nobody cares.
WARNING NO. 5
Let me know when you get to warning number ten. So far it’s just comedy. Thanks for the laughs buddy. Like a chick hen hissing at a hungry cat. You are making me hungry pal.
that should not take long in your case.
SEE YOU GOT TWO MORE THAT IS 7……for good luck.
Yes I do “get it” John K. And the proof is written in black and white on the “Long Term Interest Chart” so I hardly need to get creative to prove my point. The link I did not post yesterday for rates going back 222 years (22 decades) is below.
About half that period existed prior to the existence of Federal Reserve!
Please review it carefully from a technical standpoint. What jumps out at you immediately is that we have have rate variability for a very long time with peaks and valleys going back to when records were first being kept.
Now get out your trusty ruler and draw a pair of lines across the top of the peaks and a second line across the bottoms. What is important that should be observed here is how nicely the higher-highs and the lower lows are consistent with technical analysis that would work just as well with any other chart such as stocks, general equity markets or the rise and fall of commodities.
What I mean to say is that the chart follows a very common technical pattern that we should all be familiar with already. So the behavior of the rates are subject to forces that lie outside mere interventions of a single agency.
I contend that at best the Fed controls the short term fluctuations within the very long cycle. But they have little real control over the cycle itself. And when we are talking about the price of money we are getting right to the heart of the business cycle which is being influenced by growing efficiencies, manufacturing, supply / demand and population growth since the start of the industrial Revolution.
Indeed, more than half the chart was formed before the Fed was even created. I am very serious here when I say we need to look a lot deeper for answers to how the rate cycle functions.
While it is very convenient to blame a single agency I think when you do that you have made a fundamental error in analysis because what you are really talking about is noise in a multi-century chart.
A few days ago Mr Bernanke made an effort to explain some of those dynamics to his unblinking critics. His arguments were complex though and so not easily understood by either friend or foe. Hopefully he can convey his insights with more clarity for the average man in his next post.
Meantime though, we have got to open up our minds and make an effort to understand that what is happening here is part of a very dynamic system of capital pricing that is being influenced by more than just one guy with the power to push a rate button.
The trick for us (as investors) is to understand which part of the cycle we are on whether rising or falling if we are to adequately cope with what is coming next. I have said this many times but I think it is worth repeating…..the business cycle itself is encoded on that chart and others like it.
So it is utterly essential we learn to read the runes and not get confused by the blame game that is such a popular distraction. An objective technical approach is a far better use of our time.
Long Term Interest Rate Chart – 222 Years, courtesy of Barry Ritholtz
http://www.ritholtz.com/blog/wp-content/uploads/2012/01/Long-Term.png
Basically John, what I am saying is that money is not being mispriced at all according to the charts. It is factually being priced exactly where we should have anticipated rates to be going based on a clear and defined trend downward at this time. The flaws are in how the data is being interpreted by most pundits and how blame is being assigned. For reasons none of us know, the market is behaving exactly as we should expect and the rise and fall of rates are entirely predictable over the long run.
So the market is right….the analysts are what is wrong.
Birdman:
Interest rates are where they should be based on the business cycle?
The fractional Reserve system is and always will be a house of cards.
To say the leaders of the Fed are no way responsible for where we are is just plain stupid.
Two Presidents printed “money” outside of the Fed and both were asassinated in Public with a bullet to the head.
The endless cycle of debt has been engineered. Brave men such as Ron Paul have relentlessly spoke out about it.
It doesn’t take a rocket scientist to figure out why the Fed doesn’t want any oversight,or to even open it’s books.
Let us not forget that the Federal Reserve is engaged in the business of making money period.
We have been hoodwinked,all that is left is a mountain of debt.
The Federal Reserve along with the treasury knows exactly what is really going on, and one has to assume they are “OK” with it because they have said nothing to the contrary.
John K, a voice of monetary and historic reason.
Shoot the bravest men that try to oust the royal,banking leeches and all charts lead to contrived B.S..
The key sentence in my post above is “according to the charts”, Brian. That refers to the obvious technical picture and the shape on the graph. Take another look at the long term rate chart I linked….Now make a serious effort to suppress everything you think you know about the Fed, about Politics, about money printing etc etc.
I am only asking you to be objective in your approach. To view the charts without regard to any other influences and while you do that to keep in mind the length of time it took to form the picture you are presented with.
That is to say, use the visual evidence of the chart at hand and don’t try to color it with attitude and the opinions of everyone else. People have agendas and motives Brian….the chart on the other hand does not lie.
OK, if you have come this far then do one more thing for me: Pick any point on the rate chart from the low point below 2% to the maximum peak of 14.14% and please tell me if your choice is priced correctly or if it is mispriced.
So what is the correct rate then? And according to whom?
Notice the spread from the top of the chart to the bottom across two centuries is at most 12 percent. There is wide volatility over the long term and we see extremes at both ends whether they be extreme lows or extreme highs. So again, what is the correct price of money according to you?
And don’t you think that your choice will be subjective?
OK, here is another way to look at the same problem. The rate low-point prior to today’s 2015 rates was last seen in 1946 when we hit roughly 2 percent. From there, rates rose dramatically and have ultimately fallen right back to where they began 69 years before.
We have an almost perfect double bottom! And that means rates will now rise.
Now bear with me for a minute longer. If you can appreciate that there is a strong relationship between rates and inflation and you now know that rates WILL rise based on the technical outlook then what does that tell you about your cost of living in the coming years?
See, that’s what I mean about stripping out the noise and the bullshit and bluster. The direction that the chart will take next is no mystery at all. Ergo, you are wasting breathe blaming anyone because the business cycle itself is actually dictating the regular rise and fall in the pattern just as it has done for centuries.
So I agree with you….. it does not take a Rocket Scientist to figure this out. What baffles me is how the obvious seems so implacably veiled in darkness to even the brightest of people.
We have all got to get past that. Just look at the chart with fresh eyes and everything you need to know about inflation, the price of money and even clues to where the dollar is headed are embedded in that information.
If you fail to grasp what I am trying to teach you here you are going to have a very difficult time investing and getting prepared for what is actually coming. But I am not going to help you from here on out.
You can figure out the rest for yourself.
John K is a voice of monetary and historic reason? Are you kidding me Matt?!!!! He has not the faintest clue what I am talking about and instead keeps recycling the same tired out anti-Fed rhetoric.
If there is just one person out there who understands what I am talking about this morning then please Lord, let him speak up!
WHERE CAN WE FIND THAT BASTARD………….
if he is blogging , this would be a great place for him to plant his arce for about a day.
funny J…The Long.
I can just see it now…..It would be like a Bernanke Pin~ata if he entered this blog. Ha!
That’s my new business idea: I am going to start a Federal Reserve Pin~ata company, where you can collect the Greenspan, Bernanke, Yellen triple pack. Inside is Monopoly Money!
Order now and we’ll throw in the Paul Volcker Pin~ata. It is filled with mini-Tequila bottles and Wooden Nickels – carved with Bretton Woods Collapse – Volcker & Nixon 1971.
great idea Shad…………you could call it SHAD ATTACK…..or PIN ATA OF PAIN, or STICK ME WITH IDIOTS.
I like Pin~ata of Pain!
I’m right here…J…
to funny………..dot…….
J….you call me out.
I will show up.
thanks for the prior post and support, j.
What we got was a FUNDING of THE BLACK BUDGET…..see solili report.
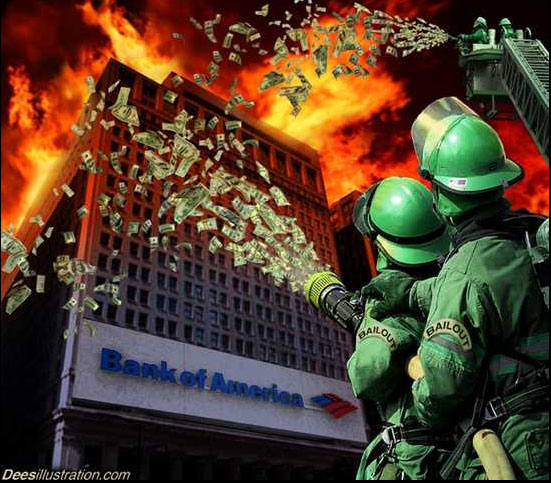
Here’s some great Federal Reserve art work you will all enjoy…
Good link, Ebolan – thanks!
This one just says it all…
Bernanke and Greenspan remind me of the skunk in the elevator who turned around with contempt and righteous indignation to challenge the other riders with: “What’s that smell?
Indeed, when someone has to keep telling us the same thing over and over again it’s because anyone with half a brain and a little common sense can easily come to the opposite conclusion.
Greenspan has admitted to intentionally misleading congress using indecipherable language, or his term:” syntax destruction”. He lied to congress. Repeatedly. And he finds it amusing, as does the MM interviewer. I’m guessing BB and JY are no better.
https://www.youtube.com/watch?v=0liegrixknA
Alan Greenspan. Douche.
Brian. I have started a new Federal Reserve Pin~ata company up above in this blog, where you can get the triple pack (Greenspan, Bernanke, and Yellen) all filled with Monopoly money. Operators are standing by to take your order….
PLACE ALL orders at:
GOVT GONE MAD
10f3 Pin ate DR.
Mad Hatter, RI.
Brilliant !
OK guys…..we have a neckline on silver and one forming on gold this morning. It is looking increasingly like my bet is going to turn out to be the correct one and that a Head and Shoulders is indeed forming up.
And that is bearish gold and silver and warning of another breakdown.
The size of the pattern suggests it could be deep decline so my suspicion is this will lead to the final leg down and the long sought bottom. That in itself may lead to a sigh of relief after so many years of this precious metals bear market.
So we don’t need to fight the tape at this stage of the game….it is going to happen whether we like it or not. Just from a technical standpoint though we can begin to formulate ideas about entry positions as early as late 2015.
So this is good news. 🙂
The dollar should peak on April 10th 2015 based on its current trajectory. That date coincidentally is the very same one when the Titanic departed Southampton in the UK on her maiden voyage that would eventually result in her sinking 5 days later on April 15th, 1912.
During the trading week beginning April 13th it may dawn on some that the dollar will in fact enter a long bearish decline equal in magnitude to its recent parabolic rise. So keep your eyes on those dates.
As an aside, Gold has had a bad habit of taking a face plant on April 15ths the past few years. I continue to believe that it will take its final leg down even as the dollar begins to fall back.
Very,very,..interesting!!!
Scott Adams take on “Technical Analysis” (courtesy of Ed Steer)
http://d1w116sruyx1mf.cloudfront.net/ee-assets/gsd/funnies/150331Dilbert.jpg
Beautiful post Chris.
I’d say that to me, you’re at your best when you’re on your own. 🙂 🙂 🙂
Said it differently: “Chris el mas bueno is when Chris goes solo”
Best to you,
LPG