
Charting the CRB

For all of our technical listeners here is breakdown of a number of chats focused on the CRB (Commodity Research Bureau Composite). It is important to note that the CRB is currently comprised of a number of commodities but not including precious metals. Here is what is included…
- CRB BLS Metals: Copper scrap*, lead scrap, steel scrap, tin, and zinc*.
- CRB BLS Textiles and Fibers: Burlap, cotton, print cloth, and wool tops.
- CRB BLS Livestock and Products: Hides*, hogs, lard, steers, and tallow.
- CRB BLS Fats and Oils: Butter, soybean oil, lard, and tallow.
- Raw Industrials: Hides*, tallow, copper scrap, lead scrap, steel scrap, zinc, tin, burlap, cotton, print cloth, wool tops, rosin, and rubber (59.1%).
- CRB BLS Foodstuffs: Hogs, steers, lard, butter, soybean oil, cocoa, corn, Kansas City wheat, Minneapolis wheat, and sugar (40.9%).
As I mentioned the article below is very technical but there are some interesting charts the author references.
Click here to visit the posting page over at StockCharts.com.
…
- A test of the bear market low for commodities is underway
- Relative commodity action favors metals and agriculture
- Stocks to continue to outperform commodities
This week I am focusing on commodity prices, or more specifically on the Commodity Research Bureau Composite ($CRB) to see what might need to take place in order to call a primary trend turn. At the moment, the trend indicators are definitely bearish. For instance, Chart 1 shows that the CRB Index around 166 is well below its declining 12-month MA. You can also see that it broke down from a 40-year support trendline a few months ago. Using the maximum distance between the high and the breakdown trendline suggests a downside objective that is literally off the charts. However, if we use the distance as calculated from the 1980 and 2011 peaks, which are more or less identical, we find an indicated downside objective close to the 1972 low. You can see from the chart that there is very little in the way of major support between current levels and that 1972 bottom, so it’s not impossible that commodities will eventually sink that low. Even so, the blue arrows show that reversals in this indicator have consistently called primary trend bull markets during the last 40 or so years. Right now this indicator is at a marginal new record low, which means a turn is likely. It’s not yet reversed of course, but this momentum series needs increasing doses of weakness in order to maintain its downward trajectory.
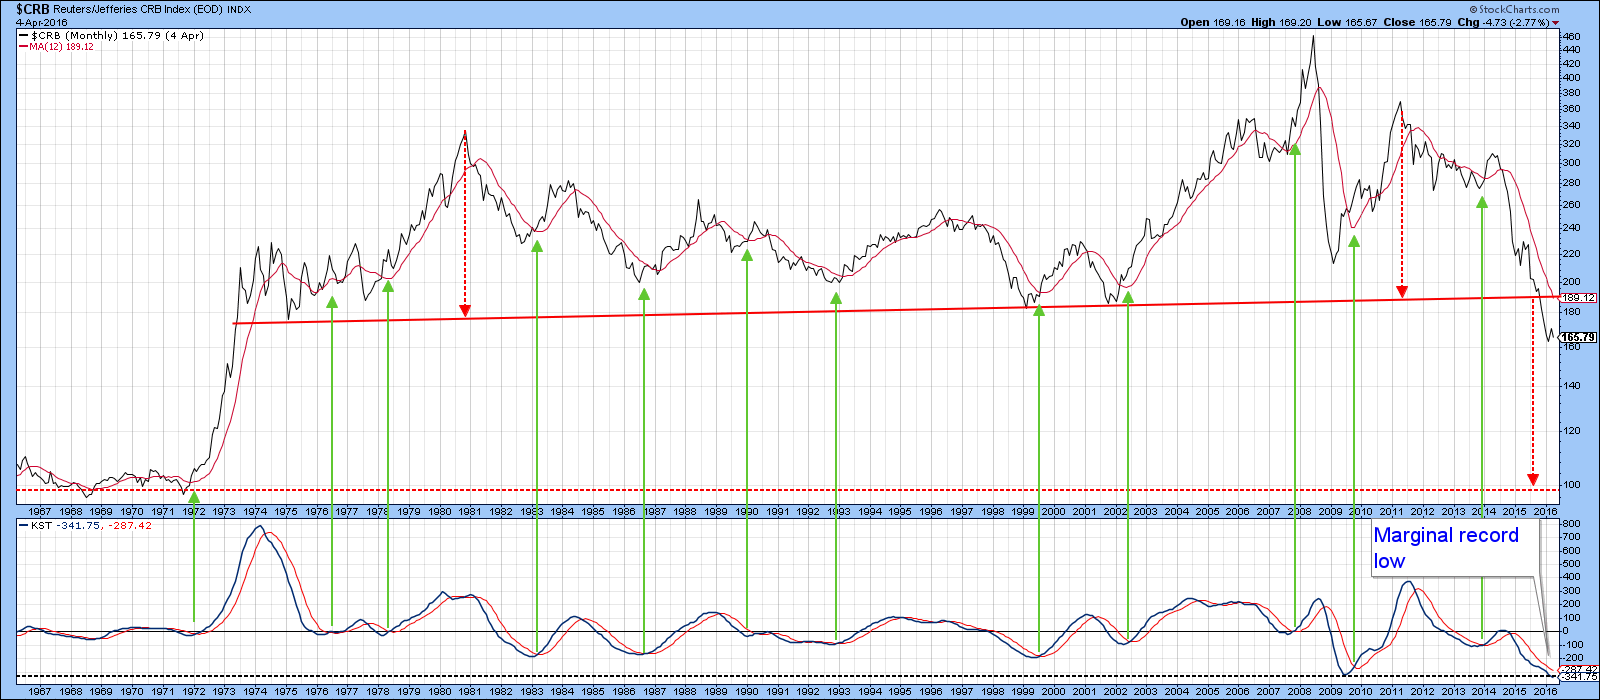
Chart 1
One indicator that has bounced is the 18-month ROC. Reversals from an overstretched level have consistently called a new bull market in commodity prices, so this is definitely a positive factor.
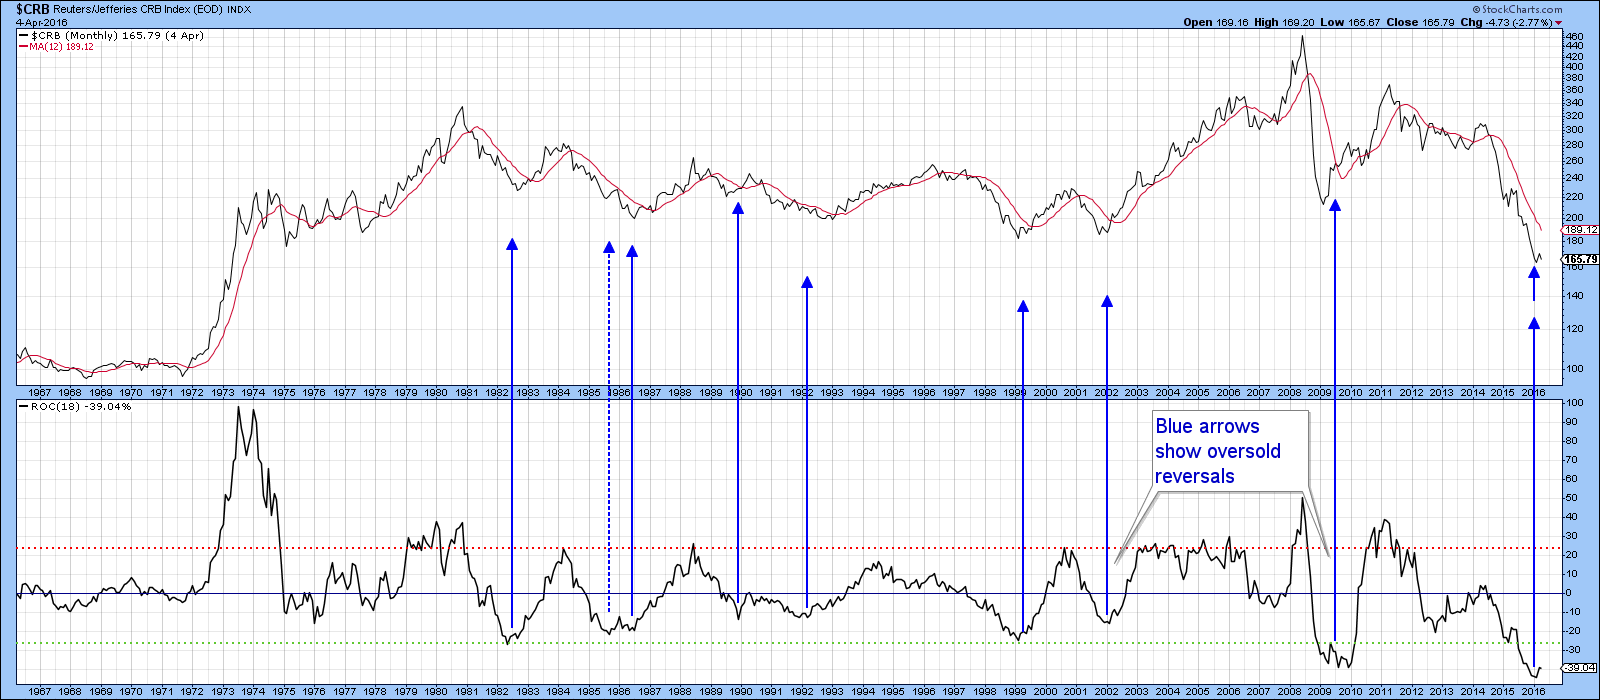
Chart 2
The sets of two small green arrows in Chart 3 point out the fact that most $CRB Commodity Index bear market lows experience a small double bottom, as the secondary test truncates at a higher level than the initial low. The fuchsia-colored arrows show that occasionally there is no test and commodity prices reverse on a dime. The large green arrows indicate upside reversals in the Coppock indicator. There are a couple of false signals but by-and-large, it works very well. Note that it has recently reversed to the upside thereby adding fuel to the bullish case. At this point, though, the technical evidence is pointing to the fact that some form of a test of the recent low is underway.
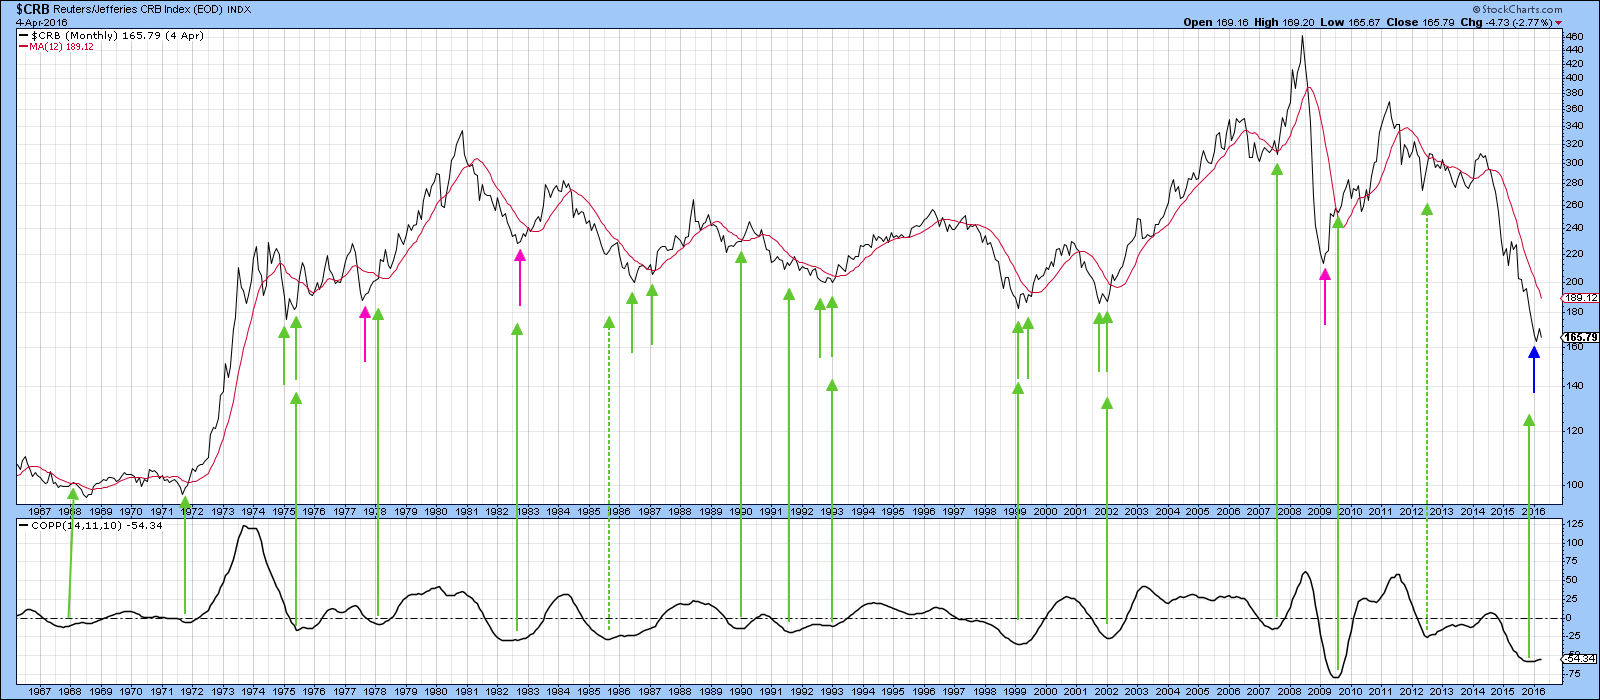
Chart 3
A test of the bear market low for commodities is underway
For example, Chart 4 features my Commodity Net New High Indicator (!PRNNHCO50), which monitors a basket of commodities registering new highs based on a 50-day time span. The red arrows show that when it has reached an extreme in the past, the Bloomberg Commodity ETN (DJP) has generally fallen in price. We need to bear in mind that these were all bear signals triggered in a bear market i.e. pro-trend signals. Pro-trend signals are usually stronger than contra-trend moves. You can appreciate this to some extent by the fact that the green buy signals all went against the declining trend and most were inconsequential in their effect compared to the strength of the red sell signals. The point I am trying to make is that if the early-2016 low turns out to be “the” bottom, the current short-term decline will likely be relatively brief. The signal I would look for to confirm the positive action in the 18-month ROC would be a successful test of the low and a rally to a post-March high. That way the price action would have achieved a series of rising peaks and troughs for the first time since the bear market began in 2011.
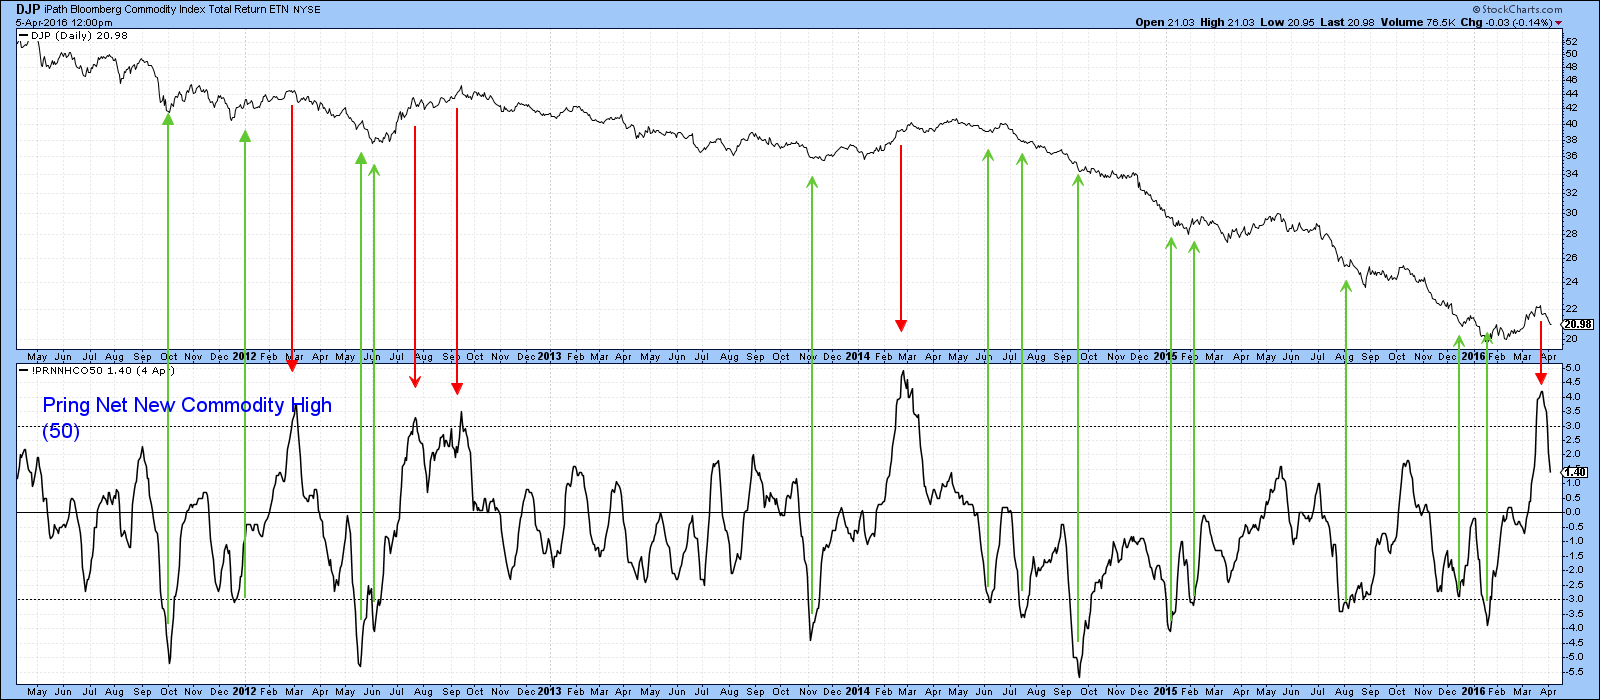
Chart 4
Chart 5 offers a different take with a different commodity index, The CRB Composite ($CRB). Under this scenario, the price is now tracing out the right shoulder of a possible inverse head and shoulders pattern. Again this is highly speculative and is certainly not a prediction. I am merely offering a map for a possible outcome. Right now the KST is in a bearish mode and still overstretched on the upside. Since the price has also completed a small head and shoulders top and violated its February/March up trendline, the probability of further corrective action is high. Those January and February lows at around 155 now take on added significance.
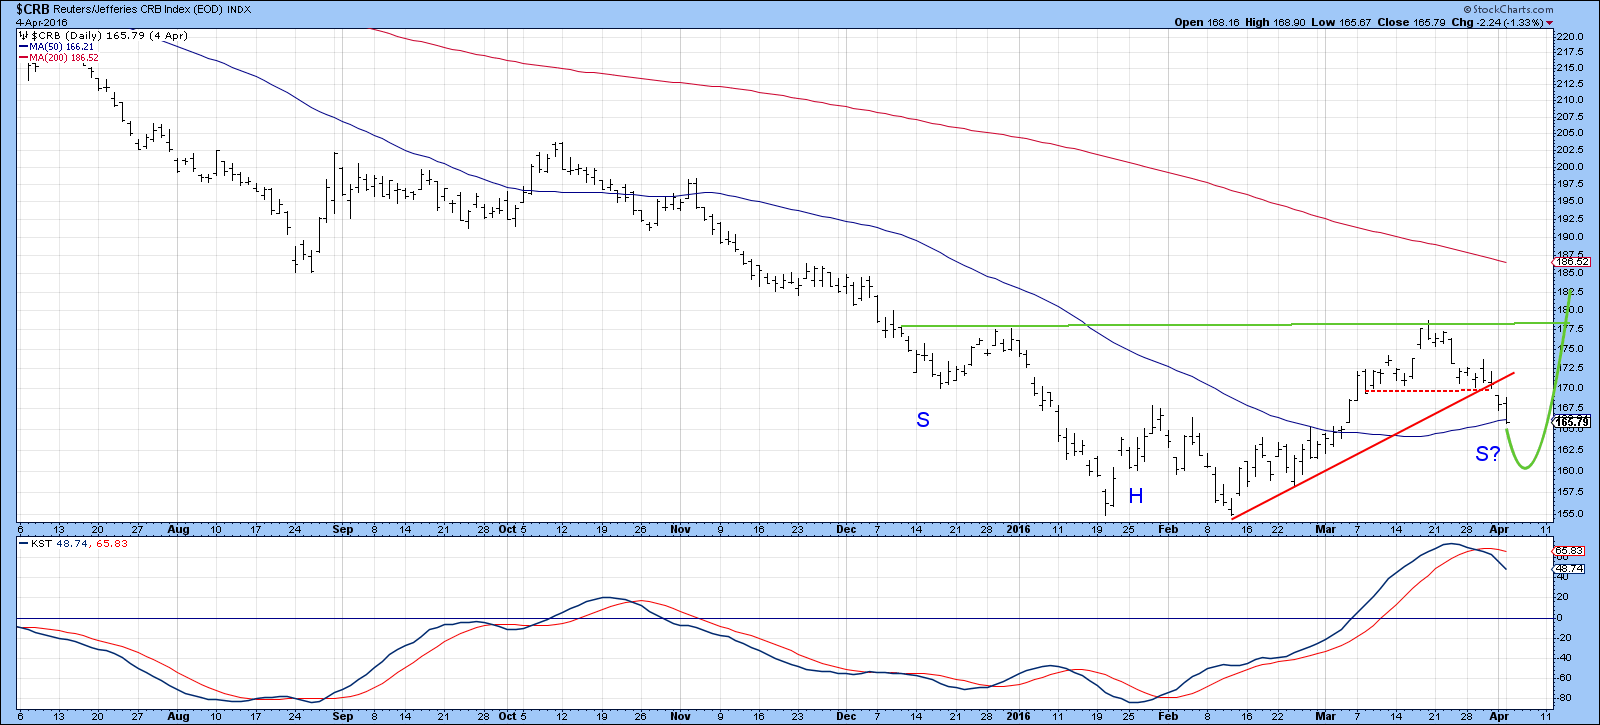
Chart 5
Relative commodity action favors metals and agriculture
If commodities are in the process of turning around, base metals could well be at the forefront of this move. Chart 6, for example, features the DB Base Metal Fund, the DBB. As you can see if you compare this chart to its predecessor, the metals ETF is much closer to its 200-day MA than the CRB Composite itself. The DBB is for sure still below its MA, but it would not take much in the form of strength to clear both the MA and the 2014-16 declining green trendline. The indicator in the middle panel is the relative strength line against the CRB Composite. It broke to the upside in February, rallied and then corrected. Now the KST in the bottom panel has started to turn up again, which suggests that the RS line is about to register a new high.
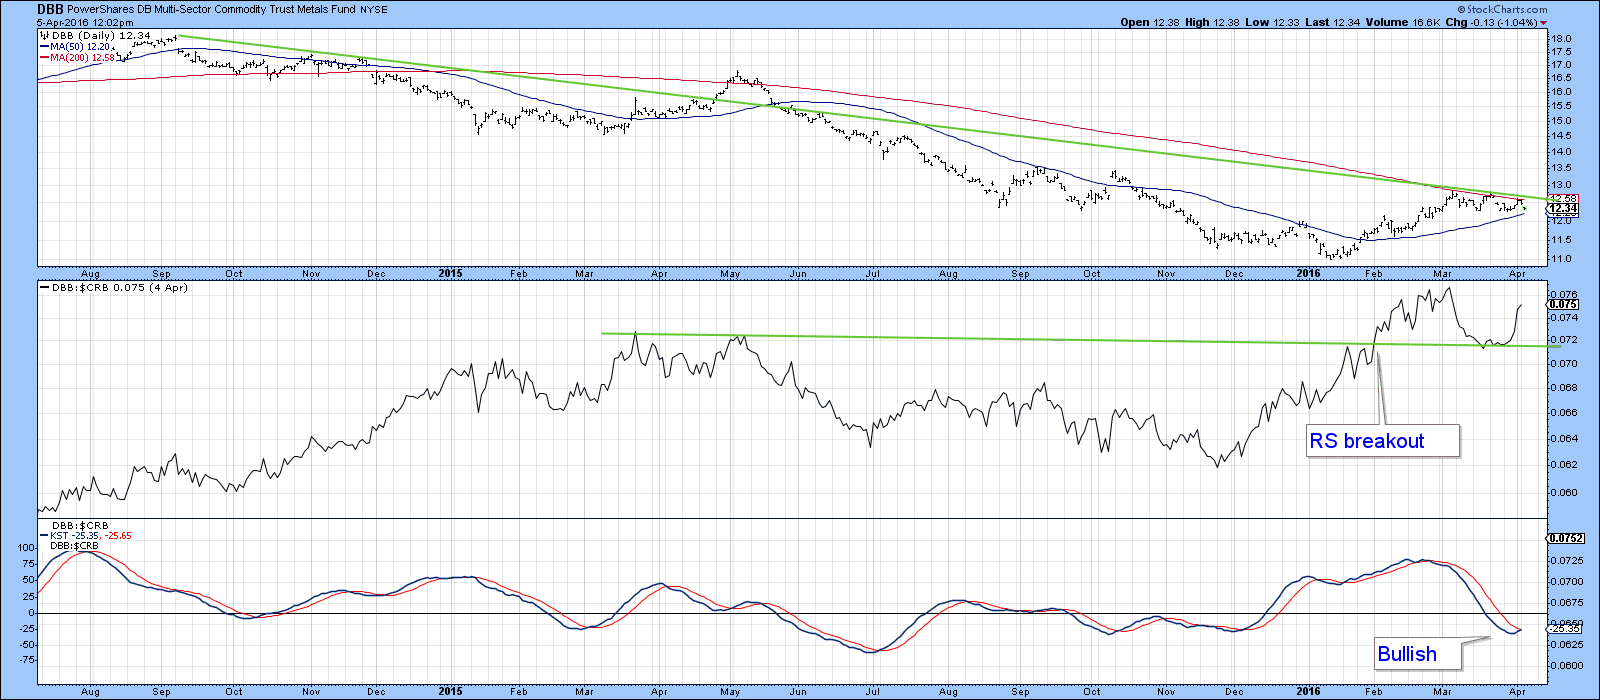
Chart 6
That compares to the DB Energy Fund (DBE), where you can see that the relative performance is in a long-term downtrend. In this instance, the KST for relative action in the bottom panel has just triggered a sell signal. It seems likely, that whatever direction commodity prices-in-general choose to take, metals will outperform energy in the period directly ahead.
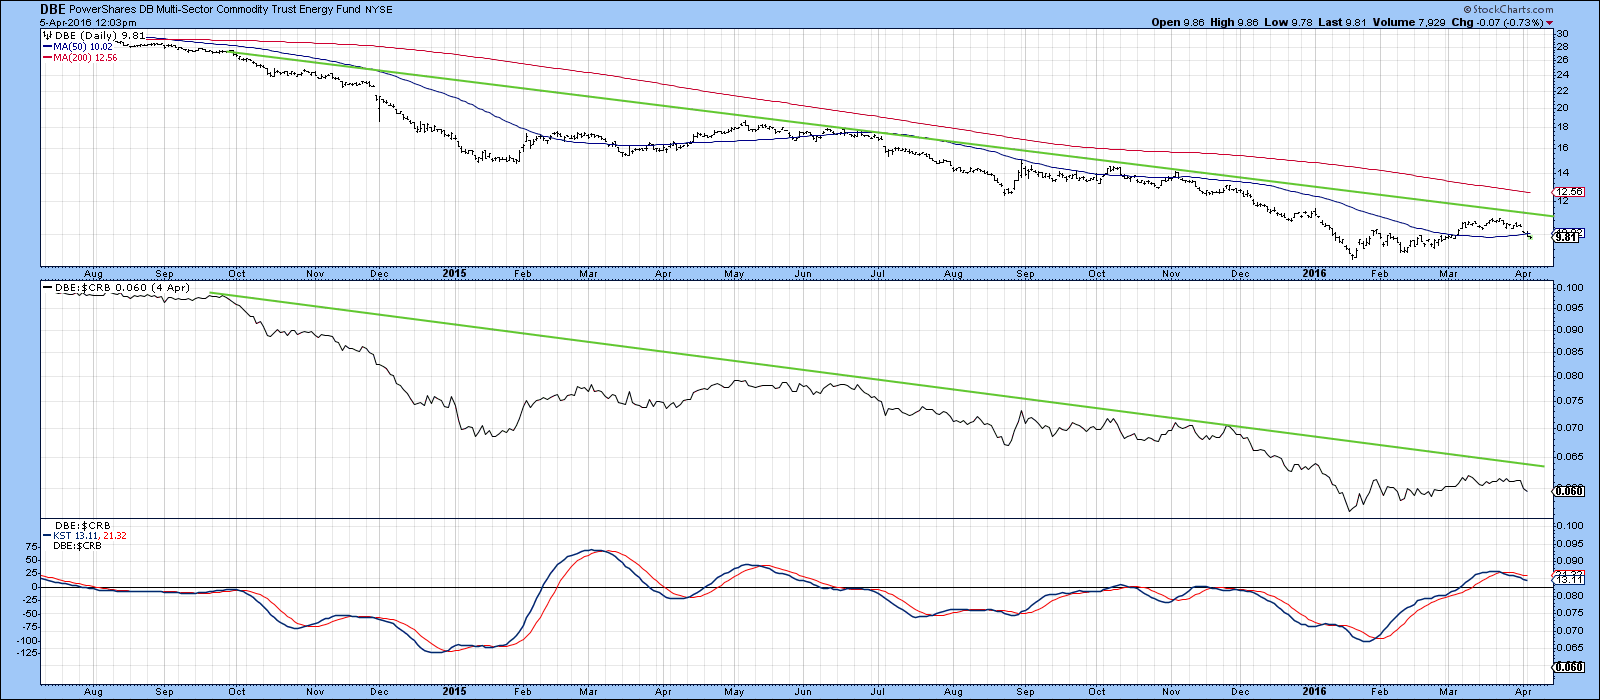
Chart 7
Finally, Chart 8 shows that the agricultural sector, as reflected by the DB Commodity Agriculture Fund, the DBA, is also in a downtrend, but one in which the possibility of a reversal is being held out. That possibility takes the form of a possible 9-month inverse-head-and-shoulders pattern. Note that there is huge resistance just below the $21 area where the 200-day MA and two converging trendlines are intersecting. Note that the RS line has been in an uptrend for a long time and broke out from a consolidation pattern last November. Now the RS KST, in the bottom window of the chart, has gone bullish again. This raises the possibility that the price may follow the fuchsia colored line and complete the reverse head and shoulders pattern.
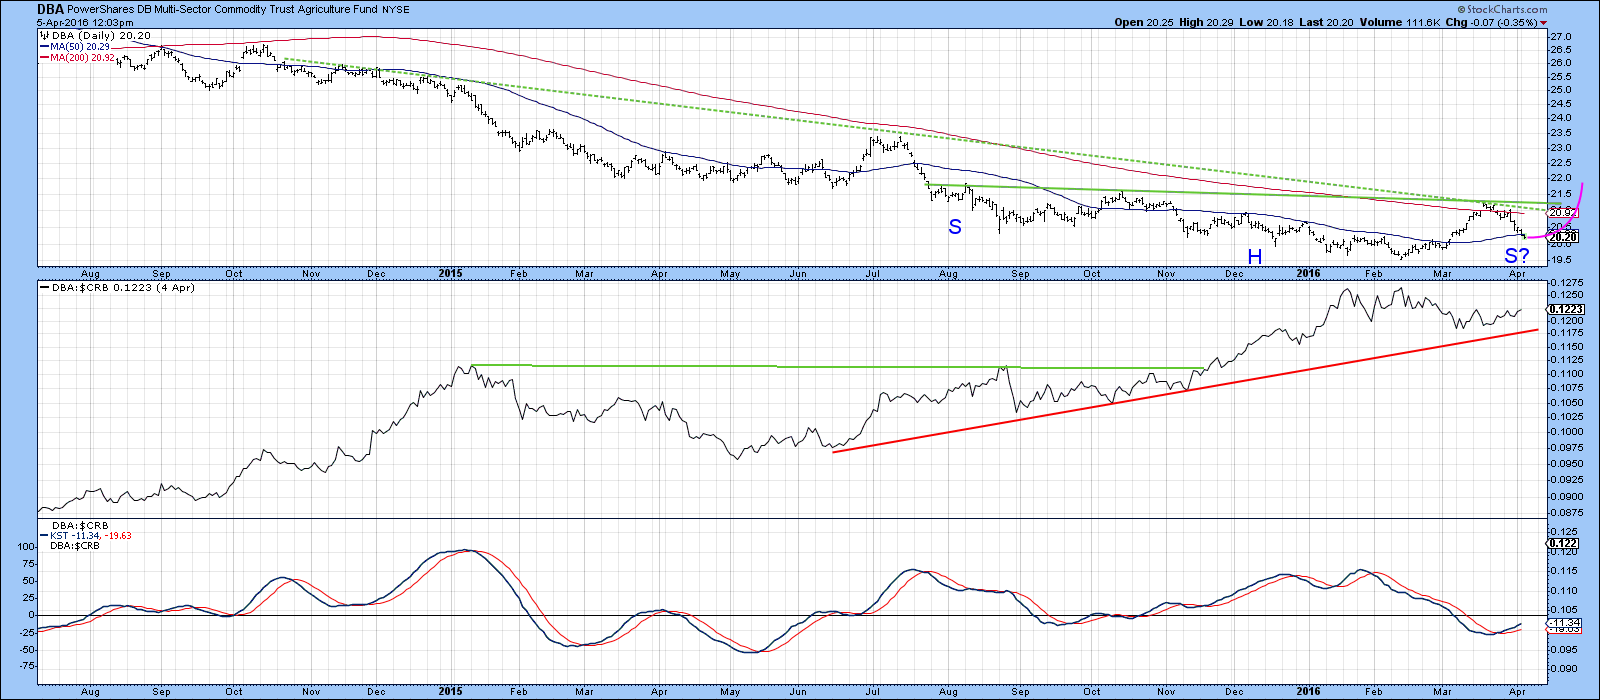
Chart 8
Stocks to continue to outperform commodities
Chart 9 compares the performance of the CRB Composite to that for the S&P. In the last few days, the indecisive ranging action has now been resolved on the downside, i.e. against commodities. Since the KST is also declining, it seems likely that commodities will continue to underperform stocks for a while.
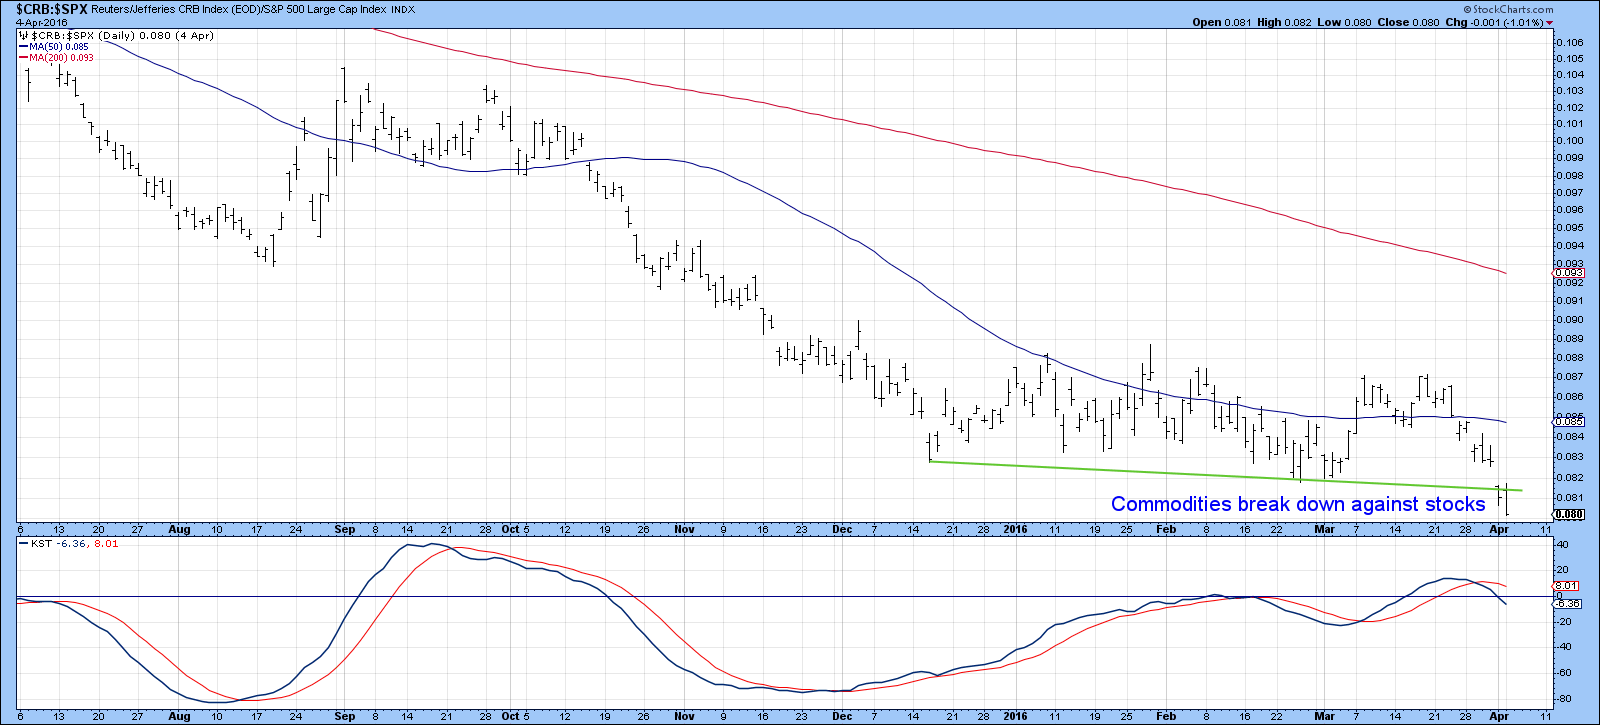
Chart 9
That extends a long-term trend as we can see from Chart 10. Note that major trend reversals in this relationship have been signaled when a trendline break in this relative line has confirmed three similar breaks for the ROC’s. We see a further setup of this nature developing at present, but none of the lines have yet been broken and the RS line itself is some way from a trendline violation. Until we can observe the four upside trendline penetrations I am assuming that commodities will continue to outperform stocks. It’s worth watching these indicators because their signals, when they come, have a high probability of being a game changer.
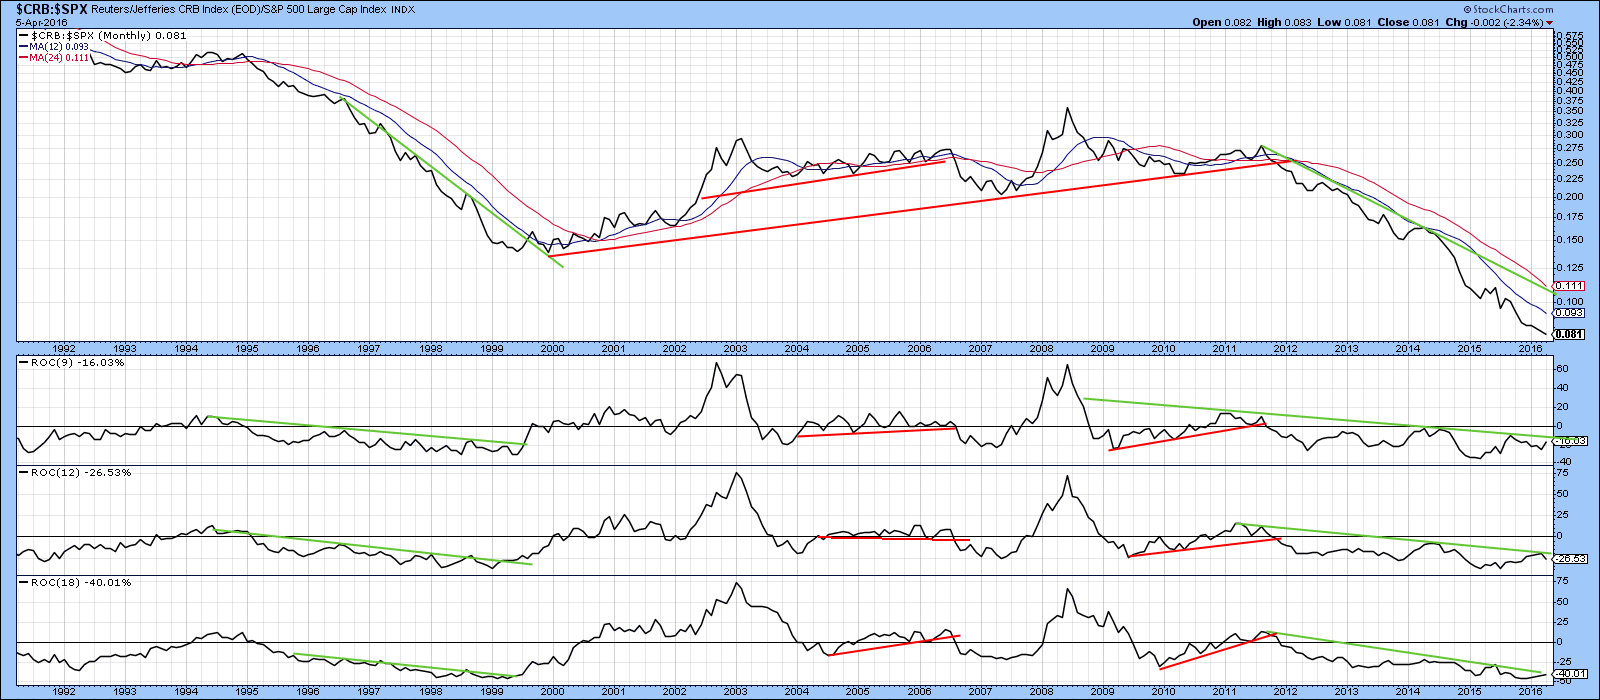
Chart 10
Good luck and good charting,
Martin J. Pring
The views expressed in this article are those of the author and do not necessarily reflect the position or opinion of Pring Turner Capital Group or its affiliates.
CRB weekly:
Good chart. I still hold out it is possible that the CRB may come back and test that 155-156 double bottom one more time, and if it can stall that off for the summer, then it would appear commodities have finally bottomed. We are entering the timing over the next few months April-June where a commodity slump would be expected due to seasonality, but everything seems to be holding up pretty well at present.
Yes, anything that is mined is technically a commodity but from an economic/investment standpoint, there’s no reason to consider gold a commodity at all. When it comes to silver, the price action tells me that it, too, should not be treated as a commodity. The supply/demand swings that shape its price come from the investment side not industrial. Its price is set at the margin by investment demand.
This makes perfect sense since its above ground supply (stock) equals decades of production (flow).
On the following chart, you can see that silver is up 70% since Oct. 2001 and the CRB is down 12%. Also on that chart, you can see that silver has behaved far more like gold than commodities since the summer of 2014.
If industrial demand mattered much, I doubt that silver would currently be trading at 107.34 times copper despite stocks totaling probably three decades of production (with all the mine closures pushing production down, it might be a more gold-like 50 or 60 years. In a bull market, stocks can drop below 20 years of production.)
Those are some valid points, and in general I agree that Gold & Silver are more financial instruments than anything, but was just pointing out they are still classified by commodities by the people that weight the CRB as outlined below, and they are both used in industry (Silver more so than Gold).
My reason for belaboring my point is that commodities are no safe haven, relatively speaking (RELATIVELY). They are driven higher in real terms by a healthy economy while the opposite is true for gold. Just as the moon makes no light of its own but merely reflects that of the sun, silver’s moves are a reflection of gold’s.
That point I agree with wholeheartedly. I don’t consider commodities safe havens. I do consider Precious Metals, certain currencies, and long term treasuries safe havens.
BTW – I like that Silver moon and Golden sun analogy, where Silver is more “reflective”.
Fwiw, I do not consider long term T bonds to be a safe haven at this time. At least not in real terms.
Since the 2008 crisis the long term t bonds have been a safety play for some, but they are also a big bubble that will eventually pop. You’re probably correct as far as real terms, but I normally just stash money in them for short amounts of time when I am indecisive on where to put my cash, so I just use them as a storage tank for funds while I’m waiting for a better trade set up in a certain sector to open up, or if it is a “sell everything” day.
Gold and Silver are definitely “Money” but they are also Commodities. Gold has some jewelry, technology, aerospace, and medical uses, but is clearly mostly a Money and store of value. Silver is 50/50 between store of value and industrial metal commodity.
_________________________________________________________________________
Current Reuters CRB Components
Markets Subgroup Weight
Energy Crude Oil, Heating Oil, Natural Gas 17.6%
Grains Wheat, Corn, Soybeans 17.6%
Industrials Copper, Cotton 11.8%
Meats Live Cattle, Lean Hogs 11.8%
Softs Coffee, Cocoa, Sugar
Orange Juice 23.5%
Precious Metals Gold, Silver, Platinum 17.6%
17% of the CRB Commodity Index is made up of the Precious Metals Gold, Silver, Platinum.
Forgot to post the link to the site with the CRB info for reference. Lots of good info:
I wonder why the discrepancy. From the top of the article:
It is important to note that the CRB is currently comprised of a number of commodities but not including precious metals. Here is what is included…
CRB BLS Metals: Copper scrap*, lead scrap, steel scrap, tin, and zinc*.
CRB BLS Textiles and Fibers: Burlap, cotton, print cloth, and wool tops.
CRB BLS Livestock and Products: Hides*, hogs, lard, steers, and tallow.
CRB BLS Fats and Oils: Butter, soybean oil, lard, and tallow.
Raw Industrials: Hides*, tallow, copper scrap, lead scrap, steel scrap, zinc, tin, burlap, cotton, print cloth, wool tops, rosin, and rubber (59.1%).
CRB BLS Foodstuffs: Hogs, steers, lard, butter, soybean oil, cocoa, corn, Kansas City wheat, Minneapolis wheat, and sugar (40.9%).
———————-
Note the word “currently.”
Currently on the CRB Index home page they have this allocation as of this morning:
Content and features
Thomson Reuters/CoreCommodity – CRB Index
Comprising a basket of 19 commodities, with 39% allocated to energy contracts, 41% to agriculture, 7% to precious metals and 13% to industrial metals.
So currently there are still exposure to Precious metals and have been since 2005. I believe the article above may not be completely correct.
There are also the separate CRB Commodity Indexes that have Precious Metals focus. So the CRB folks still consider Precious Metals commodities.
CRB Equity indices – SERIES OVERVIEW
All CRB Equity indices are based on the Thomson Reuters CRB Global
Commodity Equity index. This index is then broken down into individually
available Thomson Reuters sub-indices:
• CRB Global Agriculture Equity Index
• CRB Global Industrial Metals Equity Index
• CRB Global Precious Metals Equity Index
• CRB Global Energy Equity Index
• CRB Wildcatters Energy Exploration & Production Equity Index
Here is the most “Current” information displayed by Thomson Reuters. Maybe their website is out of date, but this is what the primary CRB home site displays:
THOMSON REUTERS CORE COMMODITY CRB INDEX
The index is comprised of 19 commodities
Aluminum, Cocoa, Coffee, Copper, Corn, Cotton,
Crude Oil, Gold, Heating Oil, Lean Hogs, Live
Cattle, Natural Gas, Nickel, Orange Juice, RBOB
Gasoline, Silver, Soybeans, Sugar and Wheat.
The index trades on the ICE Futures Exchange.
HISTORY
Founded in 1957, the CRB Index has a long history
as the most widely followed index of commodities
futures. As markets have evolved, the CRB has
undergone periodic updates – the latest occurring
in 2005. Updates include:
• Component Changes: Over the years,
commodities including eggs, oats, lard, rubber,
potatoes and wool have been dropped and
replaced by more liquid and significant contracts.
• Weighting: The 10th revision (2005) included
a weighting change from equal weighted components
to a 4-tiered grouping system designed
to reflect the significance of each commodity:
– Energy: 39%
– Agriculture: 41%
– Precious Metals: 7%
– Base/Industrial Metals: 13%
• Rebalance: The 10th revision also instituted
monthly rebalancing and rollover schedules.
COMPONEN T WEIGHTS
The 19 components of the Thomson Reuters/
CoreCommodity CRB Index are weighted as follows:
AVAILABILITY
The Thomson Reuters/CoreCommodity CRB Index
is published in Real-Time and is widely disseminated
to subscribers including traders, analysts, consultants
and numerous media outlets.
LICENSING OPPOR TUNITIES
The Index is available for license to interested
market participants for the creation of over-thecounter
products.
CRB – the first name in commodities
For more than 50 years, the CRB Index has served as the most recognized
measure of global commodities markets.
RIC CODES :
TR/J CRB EXCESS RETURN .TRJCRB
TR/J CRB TOTAL RETURN .TRJCRBTR
3-MO FORWARD TOTAL RETURN .TRJCTBTR
3-MO FORWARD EXCESS RETURN .TRJCTBER
A RBOB Gasoline 5
B Corn 6
C Soybeans 6
D Aluminum 6
E Copper 6
F Live Cattle 6
G Gold 6
H Sugar 5
I Cotton 5
J Coffee 5
K Wheat 1
L Nickel 1
M Orange Juice 1
N Silver 1
O Lean Hogs 1
P Cocoa 5
Q Crude Oil 23
R Heating Oil 5
S Natural Gas 6
GOOD POINT
Most likely you will have to repeat this several times before anyone gets it……… 🙂
It will never sink in. Everyone holds onto their opinion like a dog with a bone. Just like the manipulation argument merry-go-round.
Well, not everyone GH. I may be about to change my mind on gold believe it or not. The Yen looks like its about to take off into a whole new world and if so then that’s pretty much all-she-wrote for my 2016 gold decline theory.
The Yen has looked stronger lately.
Looks like it hit a bottom.
Silver seems to be bouncing between the 50 and the 200 day moving averages I wonder which one will give way first?
Interesting chart on your following post. One I’m into is LABU. Check out their chart!!
I’m still on the fence with bio-tech but have considered it. I don’t know much about the individual companies so I’m just looking at technicals and primarily tracking the ETFs (IBB), (XBI), and (LABU).
Good luck to you in your investing Silverdollar.
OFF TOPIC……………RICKARDS………says” the FED has $300 million in gold.”
And just who’s money is that? BANKSTERS, NOT THE US TREASURY?,
Therefore, why any mention of gold in FT. KNOX….which is USA FEDERAL GOV.property.
AND we all know THE FED IS NOT FEDERAL GOVT.
IF the bankster FED, has the gold…………then the USA GOVT. is still broke to the tune of $18 TRILLION.PLUS.
I thought it was interesting on that Kitco interview with Rickards yesterday about that line item he noticed about how the 8000 tons of gold was the amount needed to back up the Fed, and the treasury has Gold Certificate. (they’ve got a golden ticket)
This topic comes up about 2 mins into the interview:
Here is the new FED Theme Song:
Willy Wonka & the Chocolate Factory “I’ve Got a Golden Ticket”
Those who think gold and silver are just commodities, take note (you know who you are):
“It is important to note that the CRB is currently comprised of a number of commodities but not including precious metals.”