
As with any major stock market rally, this one isn’t “perfect”!

The above title comes straight from the posting below by our friend Dana Lyons. When we see stock markets all climbing to all-time highs we would expect most charts to be quite bullish. Dana points out that the NYSE Advance-Decline line has not broken to a new high and this is concerning. Read below to find out more.
Click here to visit Dana’s free blog which many more valuable charts.
Is Advance-Decline Line Divergence A Big Deal?
Non-confirmations by the NYSE Advance-Decline Line of new market highs have often signaled major trouble for stocks – will it be the case this time?
In some ways, the post-election “Trump Rally” has been among the most explosive stock market bursts of all time. Depending on the market sector or style, some bounces have been multiple standard deviations beyond anything we’ve seen in years. This has left us, naturally, with many attractive-looking charts of stocks, indices, etc., hitting new highs. But as with any rally, this one isn’t “perfect” from a technical perspective. And among the imperfections is a potentially significant one: the lack, as of yet, of a new high in the NYSE Advance-Decline Line.
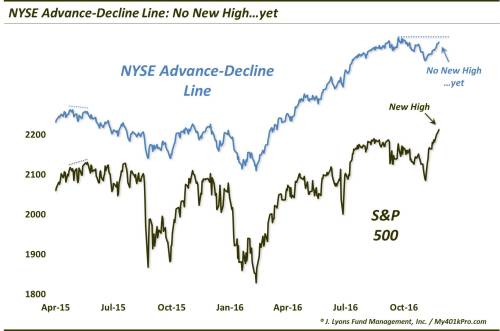
If you’ll recall, the Advance-Decline Line, or A-D Line, is a cumulative running tally of NYSE Advancing Issues minus Declining Issues on a daily basis. Now, regarding the non-confirmation, or “divergence”, there are plenty of reasonable caveats which we will touch on below. First off, however, why are such divergences potentially significant? Generally speaking, as we are big proponents of strong market breadth within a rally, we like to see the A-D Line going to new highs along with the indices. That suggests that there is strong participation among stocks in bolstering the rally.
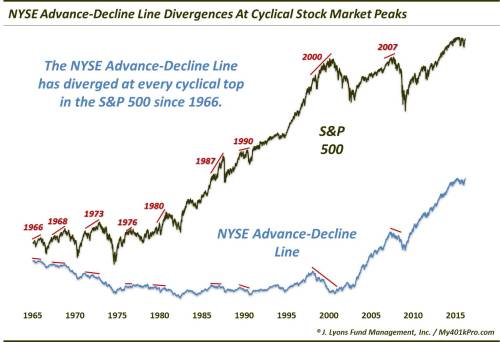
From a technical perspective, a non-confirmation by the A-D Line has historically been a significant warning for stocks – at times. Specifically, as we have mentioned before, every cyclical top in the S&P 500 in the last 50 years has been accompanied by a divergence in the A-D Line.
Now for the caveats:
- Every A-D Line divergence isn’t necessarily a cyclical market top. Indeed, on May 21, 2015, we noted the presence of a non-confirmation of the S&P 500 new high by the NYSE A-D Line. Now, that date did end up marking the high in the Index for the next 13 months (including a -15% drawdown). However, with the S&P 500 going to new highs this July, it negated the potential May 2015 top (although, some indices, such as the Value Line Geometric Composite and the NYSE Composite have yet to surpass their respective 2015 highs). Furthermore, divergences do not necessarily have to lead to even the type of weakness we saw following last May’s divergence.
- Along those lines, divergences can persist – for a long time. Consider the 2000 top in the S&P 500. The A-D Line had actually peaked in 1998, 2 years before the Index topped.
- On the other side of the spectrum, sometimes we have to be a little patient in allowing the A-D Line to catch up to the S&P 500 at new highs. That is, sometimes, the large caps may lead a bounce and it may be that the broader market simply needs a day or two to catch up. Thus, we must be careful not to prematurely label the relative large cap strength a divergence.
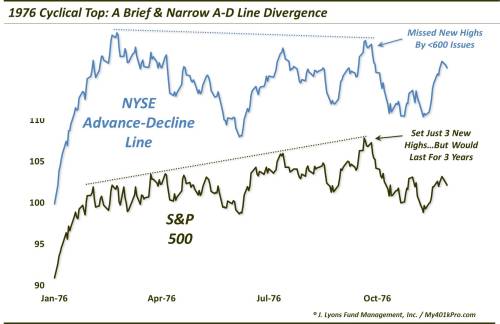
- That said, a consequential divergence can be subtle, narrow and brief at times. The May 2015 divergence, for example, saw the A-D Line less than 700 Issues shy of its April high while the S&P 500 only notched 4 daily new highs. Additionally, it is not unprecedented for a divergence at a cyclical top to be as narrow and brief as our current circumstances. In September 1976, for example, the S&P 500 set just 3 new daily highs while the A-D Line failed to do likewise. And although the A-D Line missed by less than 600 Issues, and the S&P 500 spent precious little time in new high ground, the divergence held, as the S&P would not surpass those highs for another 3 years.
Lastly, we are aware of the abundance of non-equity, bond-like Issues listed on the NYSE. And these Issues certainly haven’t had a good run of it since the election. However, while it is as reasonable as any other period in memory to place an asterisk next to the A-D Line divergence given the recent rout in bond funds, we would be careful not to write off the signal entirely. The fact is there has been a proliferation of bond-type Issues on the NYSE for some time and yet the confirmation/divergence signals based on the A-D Line have continued to be relevant and valid. Thus, again, we would not be too quick to dismiss developments surrounding the A-D Line out of hand.
So, are divergences in the NYSE Advance-Decline Line significant? In our experience, there are no divergences that are more consequential. However, A) not every divergence ends up being significant, and B) this divergence is very young and may just need a few more days for the broad market to catch up to the S&P 500. Additionally, the beatdown among bond-type Issues has unquestionably had a negative effect on NYSE breadth stats. All that said, there are a few signals that put us on alert whenever they pop up. A divergence in the NYSE A-D Line is one of them, no matter the circumstances.
_____________
More from Dana Lyons, JLFMI and My401kPro.
The commentary included in this blog is provided for informational purposes only. It does not constitute a recommendation to invest in any specific investment product or service. Proper due diligence should be performed before investing in any investment vehicle. There is a risk of loss involved in all investments.