
Will The Buck Stop Here?

Here is a straight forward chart from Dana Lyons focused on the breakdown in the USD. While there is no doubt the dollar is weak and has broken some key resistance levels there is still the long-term downtrend line that Dana points to that if broken could be the final straw for the dollar.
As a side note posting will be light today as I work on getting the weekend show up. Plus it seems a number of people are taking a day off after the busy week of conferences in Vancouver.
Click here to visit Dana’s free blog.
The dropping Dollar is trying to hang onto a potentially important line of support.
There has been very intriguing action of late in financial markets across the spectrum. And whether it’s various equity markets, foreign or domestic, commodities, currencies or fixed income, much of the action can be tied to, if not attributed to, one thing – the falling U.S. Dollar. Obviously the Dollar can have a significant impact on other markets. That fact has many market participants asking “where will the falling buck stop?” Well, from a glance at the chart of the U.S. Dollar Index (DXY), there is a technical argument for at least a halt in the pace of the Dollar’s decline right here.
On our Twitter feed (@JLyonsFundMgmt), we do a feature every week called #TrendlineWednesday (sometimes, we even get around to it on Wednesdays). Today’s edition included a trendline on the DXY that also served as our Chart Of The Day. That was due to the age of the trendline as well as its immediate relevancy to current prices.
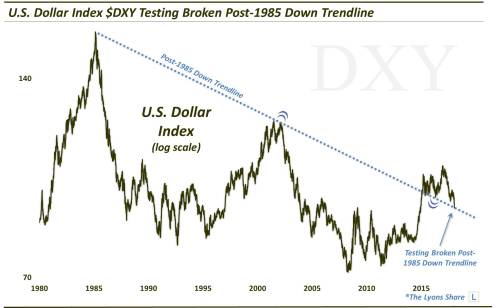
The Down trendline in question originates at the DXY’s top back in 1985 and connects the peak in 2001-2002. The trendline was eventually broken in early 2015. Since then, the former line of resistance has served as support whenever prices have dropped back down to test the top of the line. This was the case in mid-2015 and mid-2016. And Dollar bulls are hoping it is the case now as the DXY is once again testing the top of that broken post-1985 Down trendline.
So will the “buck stop here”? There are no certainties. However, today’s intra-day rebound in the Dollar, presumably spurred by President Trump’s strong-Dollar comments, occurred just as the DXY was testing the top of the trendline. Now, you may think that’s a random happenstance; however, after carefully scrutinizing the charts for many decades, we’re not big on the notion of coincidences.
Perhaps price movements occur because of contact with a specific technical chart level, or perhaps the proximity of prices on a chart create the conditions and opportunity for a “news-catalyzed” move in prices. Or perhaps both. However, we have found that there is typically a sound technical reason for why prices move when and where they do.
So perhaps the trendline in question will indeed support the Dollar and put a halt to its immediate decline. If so, it still doesn’t guarantee that the Dollar will begin to rally in earnest, or at all. What it does have to offer is a potential limit on the pace of the Dollar’s decline and I think Dollar bulls will take that at this point.
If you are interested in the Premium version of our charts and research, check out “all-access” service, The Lyons Share. You can follow our investment process and posture every day — including insights into what we’re looking to buy and sell and when. Thanks for reading!
_____________
Disclaimer: JLFMI’s actual investment decisions are based on our proprietary models. The conclusions based on the study in this letter may or may not be consistent with JLFMI’s actual investment posture at any given time. Additionally, the commentary provided here is for informational purposes only and should not be taken as a recommendation to invest in any specific securities or according to any specific methodologies. Proper due diligence should be performed before investing in any investment vehicle. There is a risk of loss involved in all investments.
C’mon. This has *got* to break down. Look at how tight those bollinger bands are!
http://stockcharts.com/h-sc/ui?s=GLD%3AGDX&p=W&b=5&g=0&id=p31769243560&a=573579434&listNum=1
The movement in silver and gold are subsrantially simply reactions to the dollar.
IN last twelve months: Dollar down 14.2%, silver up 14.2%.
coincidence? I don’t think so.
Of course they can be a dead cat bounce in the dollar, but that cat is dying, folks.
What can support the petrodollar?
Saudi Arabia is looking to China and Russia for military help, NOT the US.
Next week should be wild with the FOMC on Wednesday. Something is going to break and soon.
Have a good weekend!
Agreed. The FED is about to break wind…..
…. but the FED does that every meeting.
Is this the Last Meeting for the Witch………She is not going to do anything , if it is her last meeting. Then again , she could pull a Muchy…..
They just hiked in Dec, so they’ll probably just outline 3 hikes for 2018 and it will be a big nothing burger. Mother Fellon will say very little new, and I’d be shocked if she rocked the boat on Fed policy as her final step.
She and Ben, should go down with the Titanic…..100 yrs from now, She will not even be a blip on the radar screen….Make that 100 days. BOY….what a loser….BEN OBAMA YELLEN
😮
The gold industry’s million dollar question 2.0
by @LucTenHave on January 26, 2018
https://ceo.ca/@luctenhave/the-gold-industrys-million-dollar-question-20
I Expect An Explosive Move In Gold Reaching All-Time Highs In 2018 (Avi Gilburt)
Jan. 25, 2018 – Brian Bain
Metals sentiment in nosebleed territory,not good short term.
That could change in couple of weeks.
Yep, time for caution.
long ACAD. Buyout rumors surfacing.
(REX) (ORMNF) Orex Signs Agreement to Acquire the San Luis del Cordero Silver Copper-Zinc Project in Durango, Mexico
January 26, 2018
small IHS in $silver. Projects to about $19. There’s a larger one on the weekly that if triggered projects to about $22.
http://stockcharts.com/h-sc/ui?s=%24SILVER&p=D&b=5&g=0&id=p60479332221&a=573576273&listNum=1