
SPX Resistance May Prompt A Massive Short Squeeze

Over the past couple days I have had a number of conversations with analysts regarding the US markets inability to bounce back this year. Many people are still very skeptical that the markets will be able to climb to new all time highs. However this article from our friend Chris Vermuelen outlines the potential for a short squeeze in the S&P to push the market much higher, potentially to new all time highs.
Click here to visit Chris’s site for more technical commentary.
…Here’s the article…
Our analysis continues today with this research of a potential Short Squeeze in the SPX and other broader markets. As you are probably well aware, we, at www.TheTechnicalTraders.com, have been nailing the markets with our detailed analysis for quite a while. Our Advanced Analytical tools have called nearly every move. Nearly two weeks ago we called a massive market bottom to form in the US markets – well before just about anyone else even saw a bottom formation. In fact, we have already banked 10% profit on the first half of our best-cherry-picked setup for subscribers and it’s continuing to rally more.
Today, we are calling the potential for a massive upside breakout move on what we believe is a massive Short Squeeze position just above resistance in the SPX. Take a look at these charts.
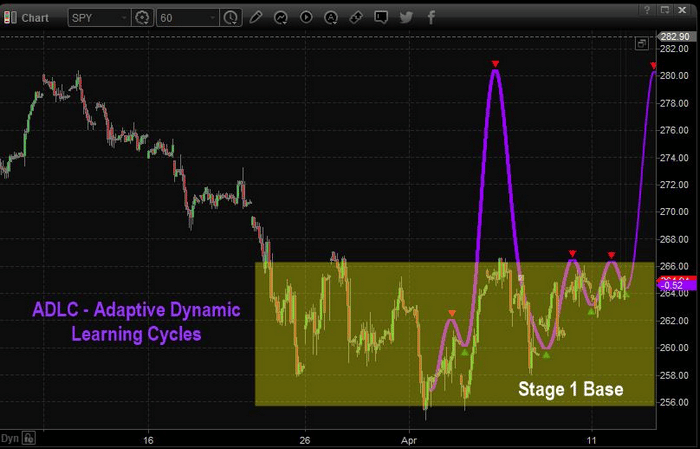
This SPY chart showing our Advanced Adaptive Dynamic Learning Cycles and the Stage 1 basing pattern that we referenced yesterday is still very valid. This resistance channel, near the top of the yellow rectangle, is very clear and we can see prices are tightening near the top of this channel. Our ADLC cycle modeling system is showing a very clear upside breakout – the massive Short Squeeze move.
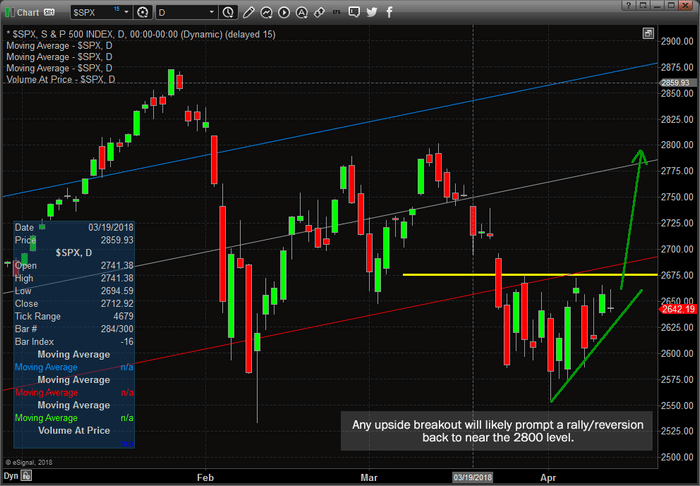
This SPX chart shows a similar setup with a resistance channel near 2675 and a very clear upside potential to near 2800 or higher. What is interesting about this chart is that the Standard Deviation channels show this move would actually be considered a “reversion trade” – back to within normal pricing channels. This means that we could see a much broader move higher with this upside potential – possibly well above 2850.
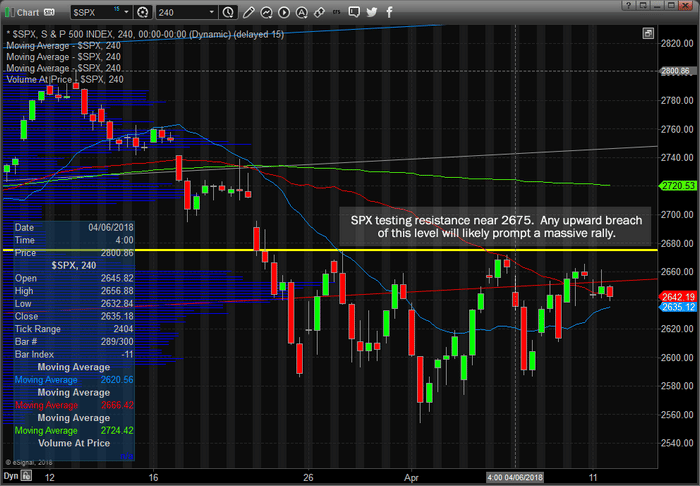
This final chart is a 240-minute SPX chart that helps to better understand and see the resistance channel that we expect to be broken today or tomorrow. We believe this downside resistance has setup a massive Short Squeeze position that coincides with our ADL and ADLC predictive analysis technology to indicate that we should see a massive upside price move in the immediate future. As traders, this means we have some real profit potential over the next few weeks with this move.
Take a look at our trade alert service Wealth Building Newsletter and tools we provide our members at Technical Traders Ltd. and see how we can assist you in finding and executing great trades like these every week. We have hundreds of members that are following our daily video and other analysis each week. We believe you should have a great team of researchers and traders backing you up with opportunities for greater profits – check us out www.TheTechnicalTraders.com to see how we can improve your trading success.
Chris Vermeulen
NICE