
12 Charts That Show The Permanent Damage That Has Been Done To The U.S. Economy

This post was sent to us by our good friend at the White House Glen Downs. There are some interesting charts that are brought up. The first couple deal with the employment figures in the US which we have chatted about at length. Some of the other noteworthy charts that are presented are the following.
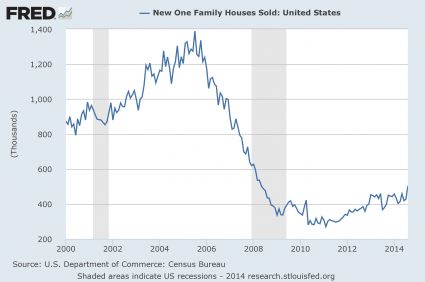
#7 New Home Sales
#8 The Monetary Base

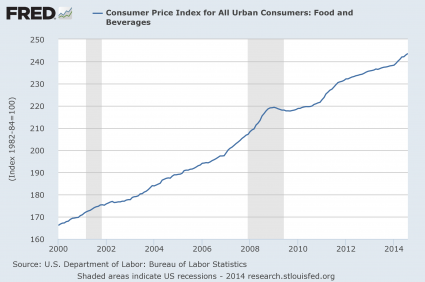
#9 Food Inflation
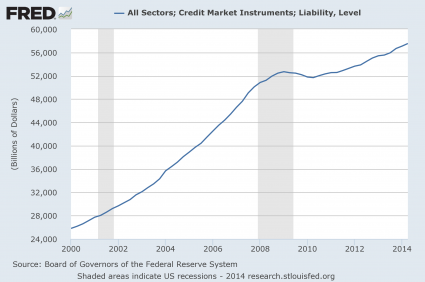
#12 Total Debt
None of these charts are moving in the right direction in my eyes.
BUY BUY BUY GOLD ! BUY SO NICE TO BUY NOW BUY !
What a bunch of nonsense. The economy is doing fine. After all, the S&P did rise from 666 to over 1900. That means the economy is firing on all cylinders. Right?
No Left!
OTC HALTED……………..zerohedge……………..any news here….second day in row.
Where did you see this? I never care about OTC but I think they are the subprime of stock market.
Jerry is right, but it is up and running again. I don’t mind the OTC at all. Just do good due diligence.
Halts been lifted. And it’s not the first time the OTC breaks.
to much volume?
I don’t know why it was halted this time, but last time is was because of lack of liquidity… too much selling but not enough buyers.
that makes a lot of cents……on penny stocks…………….thanks……
mr. cory
If fed starts QE4 do you think the maket will restore up trend right away or still down
with mother nature no matter what. your opinion?
My opinion Billy is that the conventional markets would go up.
If possible would put up some Doc’s charts for us.
THE REAL WEEKEND ! https://www.youtube.com/watch?v=39btKqMiqiQ