
Margin Debt hits historical levels, watch this spread!

Here is another straight to the point chart by our friend Chris Kimble. As much as we talk about margin debt driving the markets when we see this as the only/main factor it is very concerning. The spread pointed out below can continue to grow but this is another sign (not timing indicator) that the US markets are far too extended.
Click here to visit Chris’s site for more great charts.
…Here’s the posting…
CLICK ON CHART TO ENLARGE
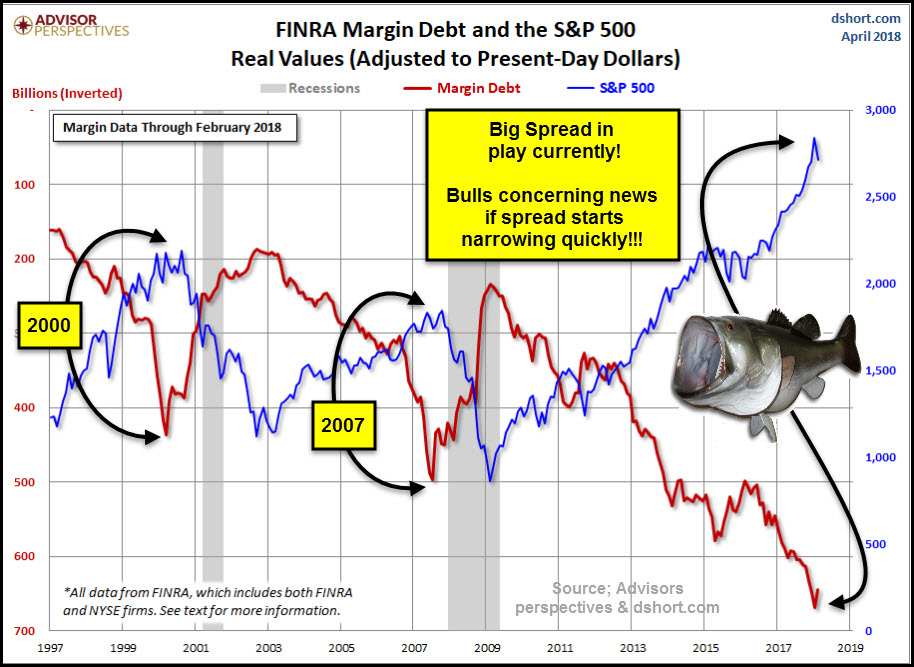
This chart from Advisors Perspectives/dshort.com looks at the S&P 500 and margin debt (inverted) over the past 20-years. When the spread was wide back in 2000 & 2007 and started narrowing (investors reducing margin exposure), stocks started to sell off.
This chart updates that the spread is now at historical levels. Should this spread start narrowing quickly, it would send a short-term caution message to stock market bulls.
If past performance provides any clues, it looks to me like a major correction could take the S&P below 1000. Haven’t heard any pundits actually spouting that figure.
MASSIVE support at 1575 horizontally….If nukes go off I still think it would bounce there even if momentarily
Could be right. I think the amount of fear that causes the outright selling could overwhelm most support structures if it’s extreme.
Yep, lots of support levels between here and 1000 on the S&P.
The last two bear markets fell about 50% and 57%, so from the peak, comparable falls now would take it to 1235-1436.
I wouldn’t be surprised by a bigger fall, like you suggest, given how off-the-rails everything is. All bets are off for the next bear market. Careful diversification and a preference for the tangible over paper promises is key.
Is anyone considering shorting the markets here then?
It has been a terrible idea for the last decade (since the 2008 financial crisis bottomed in early 2009) but still, if things roll over and drop 50%-57% from here it may catch the vast majority of Bears out of the market and kicking themselves for the next decade for missing the actual big move down.
Something to ponder, but usually the markets take the escalator up and the elevator down, so a pullback like that would happen over a relatively short amount of time compared to how long the run up has gone on.
Yes, could be the experience of a lifetime.
Not a timing tool but that is mind bending…I mean wow!!!!,,that said, 70% higher margin debt than 2007 peak with market 2.5ish times higher…what does that say?…Sort of okish???