
A Long Term Look – Gold and Silver Still Need A Break Higher

Below is a look at the long term trend for gold and silver from our friend Chris Kimble. While the recent moves in the metals have been encouraging he brings up that the metals need to move a little higher to break the long term trend (since the highs in 2011). Chris is not saying he thinks the metals are going back to the 2015 lows. Rather he is pointing out that the recent moves have been disappointing.
I am still encouraged with the recent movements in gold and silver but the fact is this recovery has been fairly slow. That can lead to longer more sustainable rallies but can also be frustrating at times. Such as now with gold moving back below $1,300. The drop from 2011 to 2016 was steep but look at the beginning of the chart from 2019 where gold and silver went pretty much straight up. I believe we are staring a new leg up but this time it will take longer and int he long run be much healthier.
Click here to visit Chris’s site for more technical commentary.
…
Gold & Silver long-term trends have been lower since highs back in 2011. Counter trend rallies have continued to frustrate metals bulls as they continue to fizzle out. Are current counter trend rallies in Gold & Silver about to fizzle out again?
Below looks at Gold and Silver on a monthly basis over the past decade-
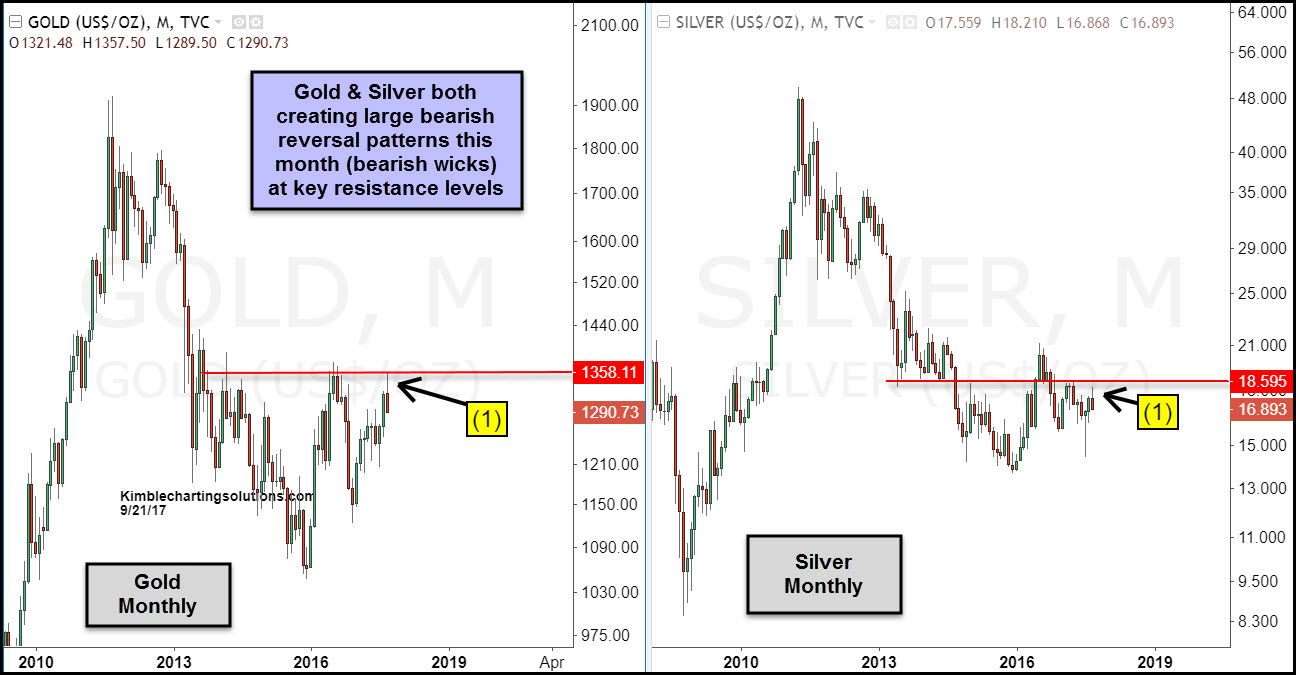
CLICK ON CHART TO ENLARGE
Gold and Silver this month tested resistance lines that were based on old highs/lows at (1). As both were testing the underside of this resistance, both have created large bearish reversal patterns (bearish wicks) at each (1).
Metals bulls do not want to see this type of pattern at resistance, while in long-term downtrends. This could also be concerning news for metals bulls, as traders have established positions where historically Gold and Silver were closer to highs than lows.
The Power of the Pattern has been sharing this chart for the past few months with Premium and Metals members, preparing them for this key level. If patterns in the metals complex is of interest to you, we would be honored if you were a member.
We are far less optimistic that this will be the final outcome in a world in which a no less than 30% of Americans think the Federal Reserve is a national park…
Maxy Waters qualifies…………lol
Everybody knows that the dice are loaded
Everybody rolls with their fingers crossed
Everybody knows the war is over
Everybody knows the good guys lost… leonard cohen
Gold failed the 1360 region… Again. This is the third or fourth it has done so in the last few years. It would seem this price range is major resistance and the more often gold fails it, the stronger the resistance becomes
good point……..unfortunately………
Gold surpassed the $1360 area last year up to $1377.50.
Gold just recently made the highest peak of 2017 at $1362.40
Gold will likely take out both of recent prior peaks and test $1392.60 and $1434 on the next impulse leg up.
http://stockcharts.com/h-sc/ui?s=%24GOLD&p=D&st=2011-09-01&en=today&id=p12756818629
Round numbers like $1360 are rarely where real resistance or support comes, and Gold had made it above $1360 the 2 times it tested that region over the last 2 years. (albeit it didn’t surpass it by very much)
The only number that really matters in close proximity is taking out last year’s high of $1377.50.
Yeh when I say “the 1360 region”, Im not referring specifically to that exact number but more the area around it. That includes that brief spike to $1377 last year.
OK – I see what you mean then. Just that general area.
We’ll see if Gold has the juice to take it out in the balance of 2017, but if it blasted through there it would be quite bullish.
Agreed. This resistance we talk about is pretty solid so if it could blast through like you say and even overshoot pass $1400 that would give it some leeway when correctong again. Time will tell.
$indu:$gold ratio about to explode to new multiyear high, and put the 200 month MA behind it for good.
Face it, commodifies are deader than dead. They will be basing for years to come, if not breaking to significant new lows soon.
The yen is headed to the dustbin, and along with it commodities and gold. Yes, gold will out perform yen in the very very long run, but we are all dead in the long run.
This is where the commodity bulls who have been devastatingly wrong for a decade are going to get their faces rubbed into it in spectacular fashion as the Dow heads to the moon and their precious commodities in the opposite direction.
Nothing ever puts a Moving Average behind it for good, and anyone that follows the markets knows that every market or sector will return to the mean.
As for the DOW “Heading to the Moon” from here…. we’ll see how it goes over the next few years compared to the commodities.
I wouldn’t count those chickens until they hatch. Some of the Moon Eggs may get squashed.
A little too pessimistic for my liking spanky but some good points nonetheless.
This current move in gold and silver as well, is why Ive been reticent to label the PMs in a new bull. As Ive mentioned before, this has happened numerous times in the past and it is repeating again.
If gold doesnt rebound well above 1300 soon (in the next few days), then its just the status quo im afraid. Be default the same applies for silver.
http://www.zerohedge.com/news/2017-09-21/albert-edwards-citizen-rage-will-soon-be-directed-schizophrenic-central-banks