
Gold, 2016 All Over Again?

I found this article, posted on Seeking Alpha, very interesting. It is the bearish case (at least short term) for the metals and brings up some correlated markets/sectors that we have and have not talked about. I don’t agree with the overall conclusion but I did find it interesting overall. I’m looking forward to hearing what you all have to say. Please keep the comments civil if there are any disagreements 😉
Summary
- Gold correlates with several other markets.
- These correlations sometimes show repetitive patterns.
- We show that the trading pattern of gold, in relation to these other markets, is very similar to 2016.
- This idea was discussed in more depth with members of my private investing community, Away From The Herd. Get started today »
In this article, we discuss the pattern similarity of gold and several other markets in 2016 and today.
Just like in 2016, the ‘early-winter-to-late-summer’ inverse pattern between gold and TBT is still in play. TBT followed bond yields lower, but since the start of September, it has been grinding higher, and gold has been dripping lower (chart below).
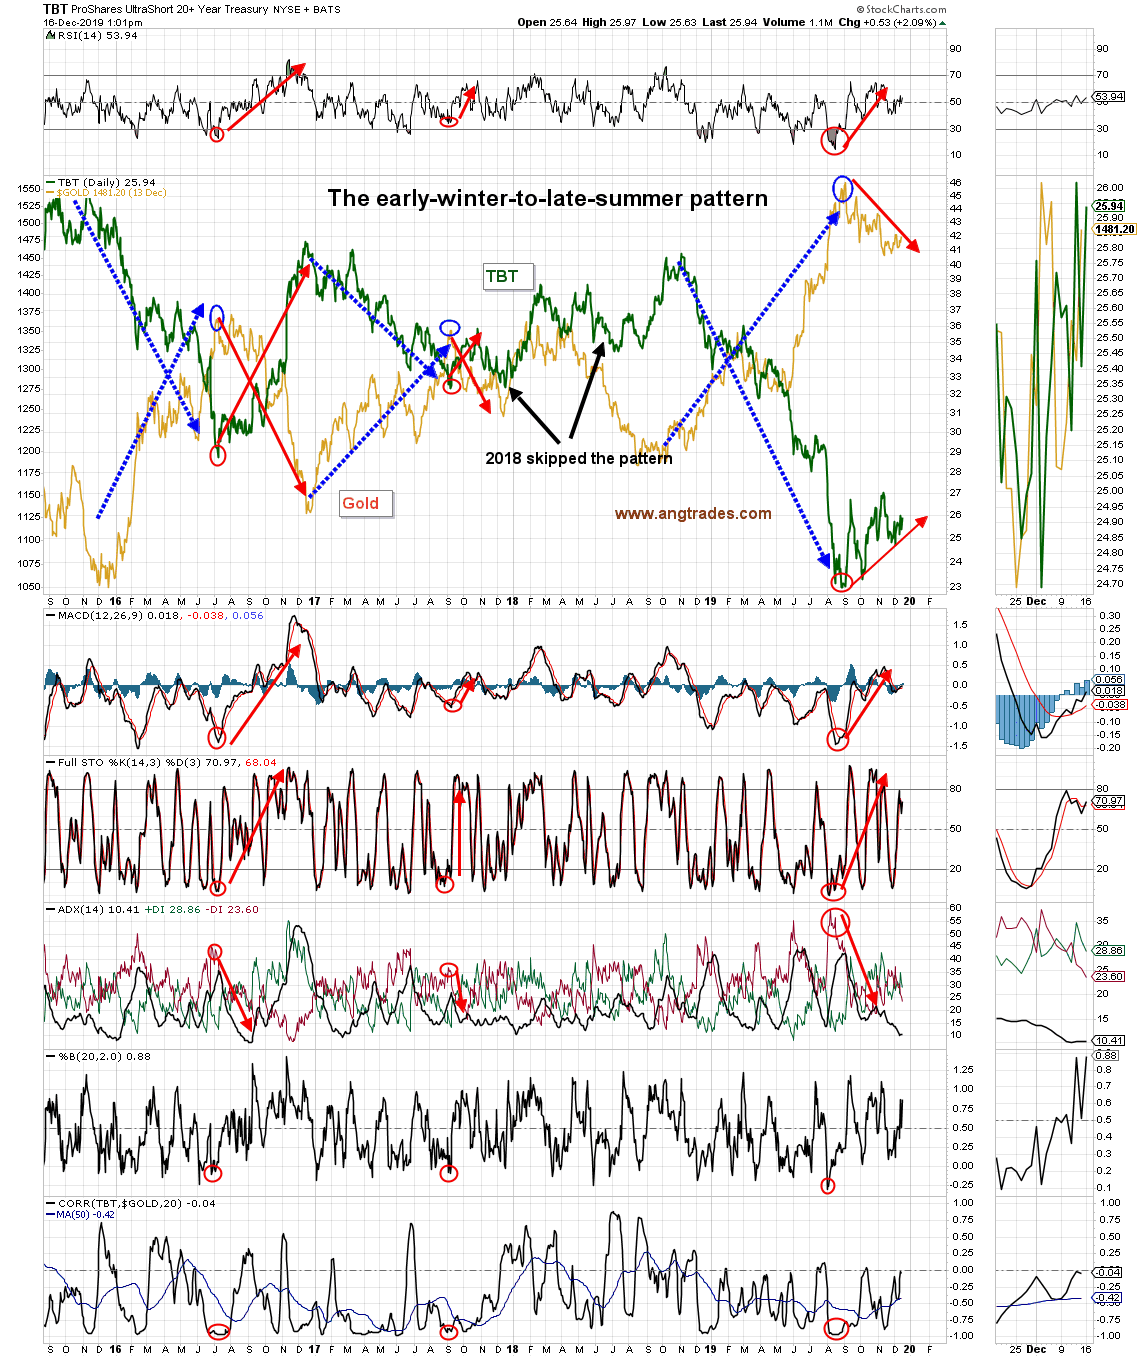
Also, similar to 2016 when gold’s RSI rose above 80, and gold first climbed higher before dropping ~25%, gold is now dropping, but is only down 5% from its recent high. A similar move as 2016 would see gold reach down to the $1,200 area (chart below).

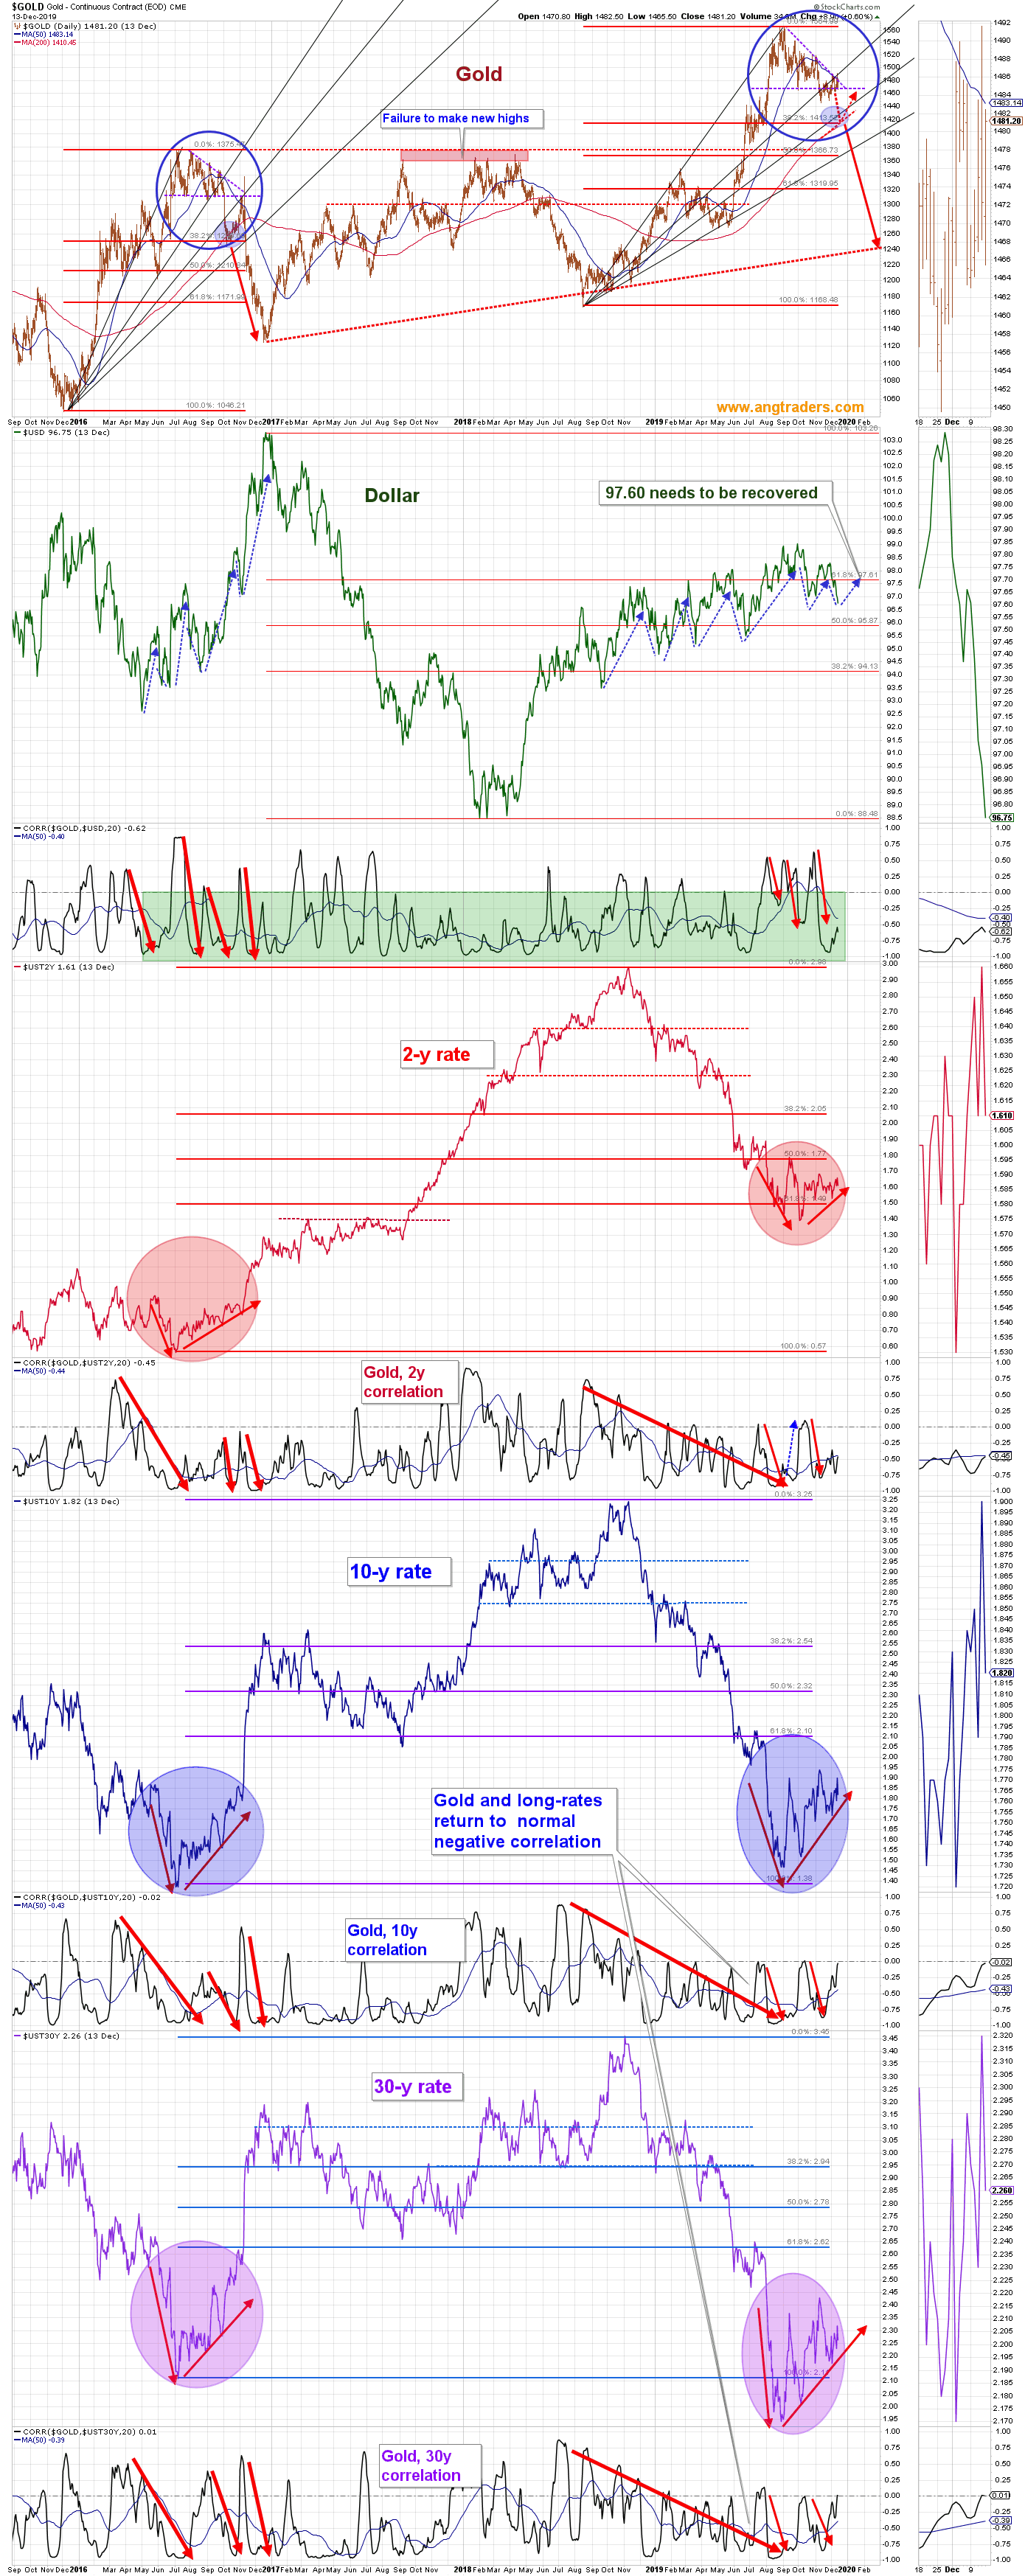
Like in 2016, gold is riding its 50-day MA lower as rates and the dollar move higher (chart below).
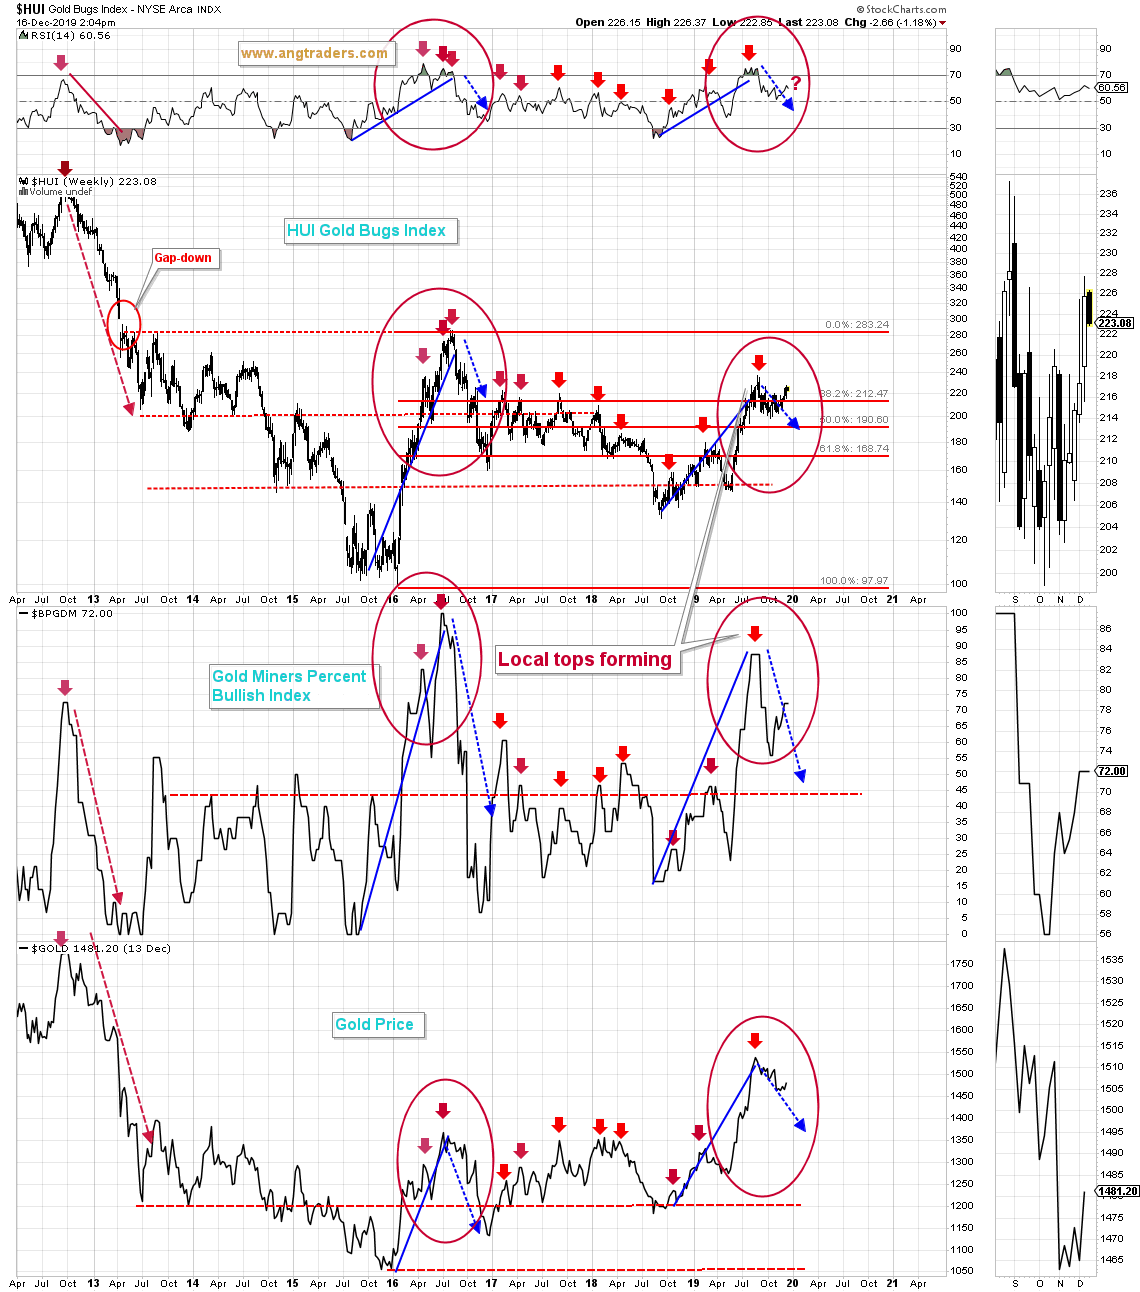
The HUI and the Gold Miners Percent Bullish Index are both continuing to replicate the 2016 pattern (chart below).
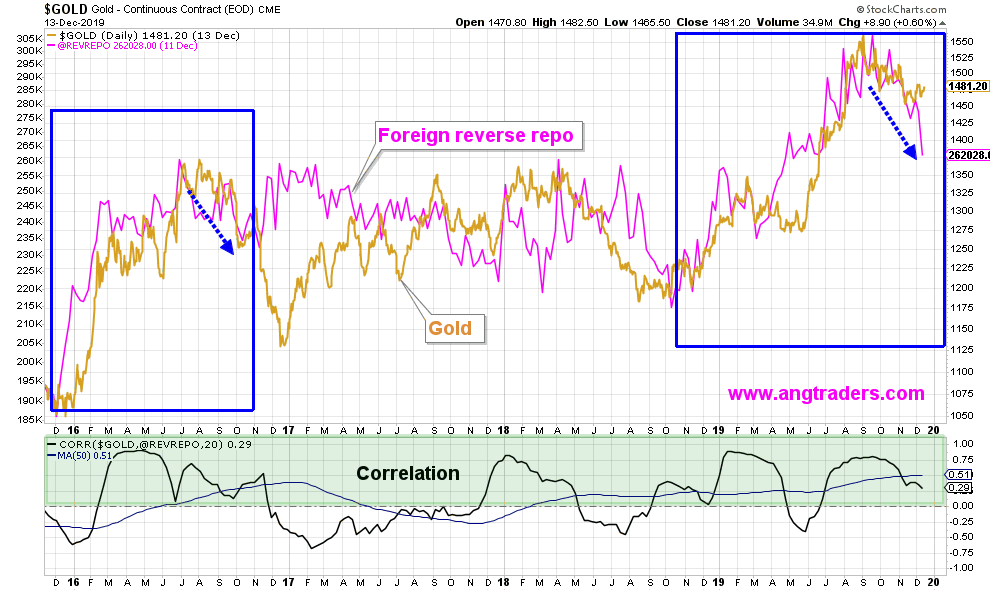
Although most investors recognize that there is a relationship between gold and the dollar (see above), nobody seems to realize that the reverse repo market that the NY Federal Reserve conducts on behalf of official foreign accounts, and which is five times bigger than its domestic overnight repo market, is also intimately involved with gold.
Reverse repos drain reserves, so it is no surprise that, as the Fed adds to its reserves, it reduces its foreign reverse repo activity. And since gold has a strong positive correlation with this market, it has been following this market lower. Since the Fed seems determined to keep reserves elevated, it is unlikely to increase its reverse repo activity, and therefore, gold is unlikely to rally past its 50-day MA (chart below).
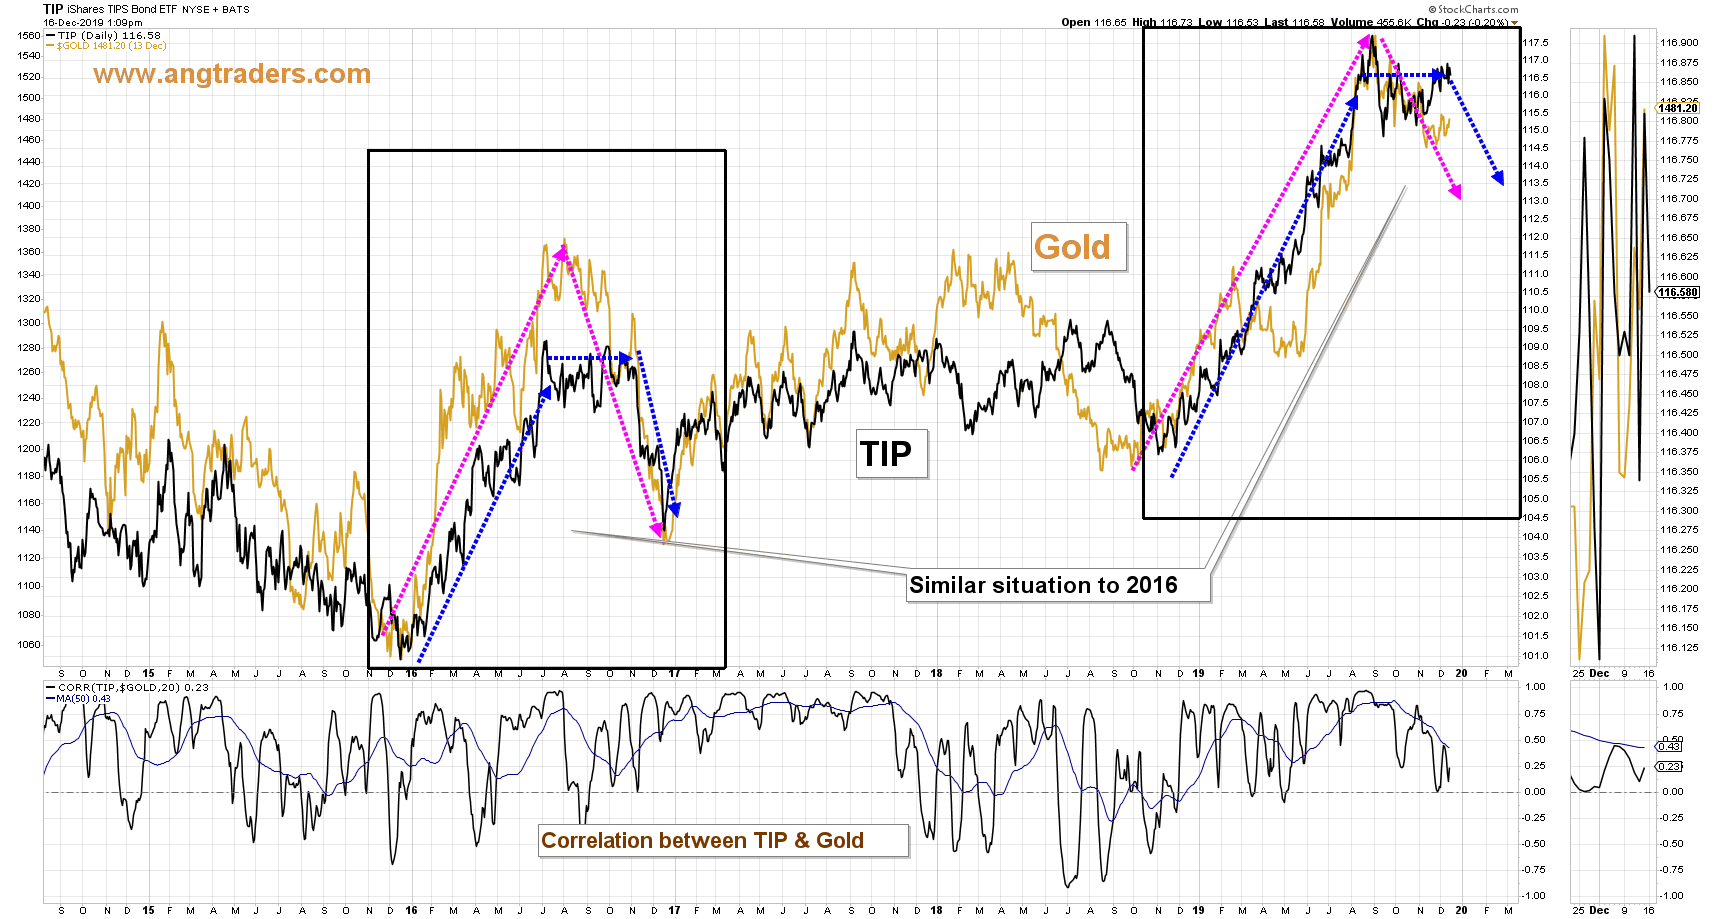
Another market that is positively correlated with gold is the Treasury inflation protected securities market (NYSEARCA:TIP). Here again, the similarity with 2016 is striking (chart below).
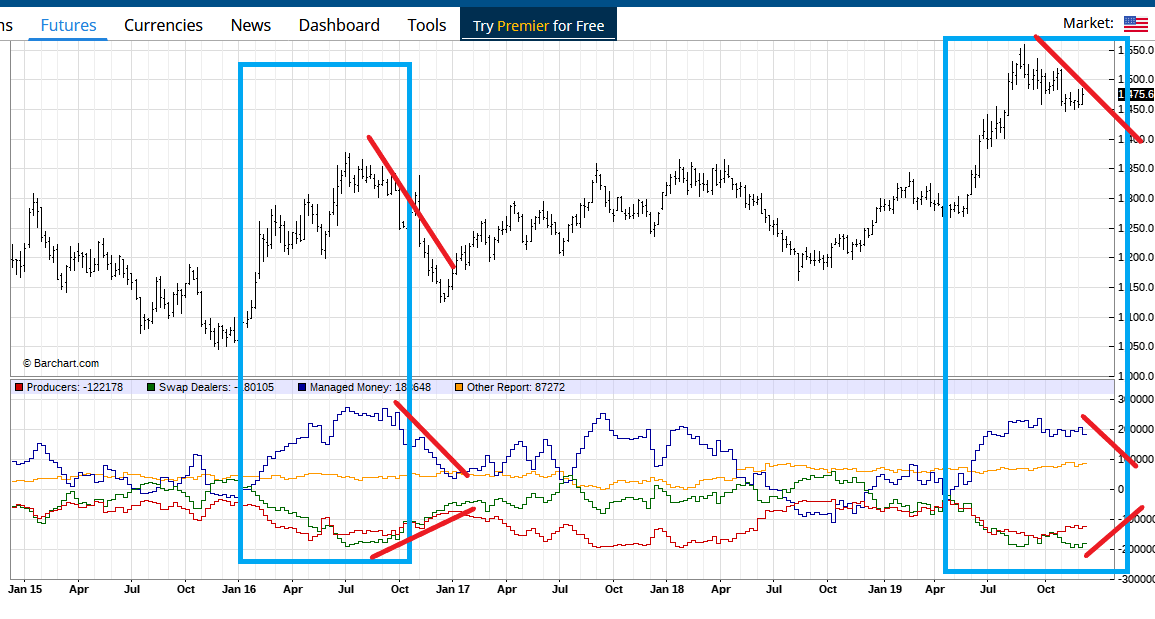
Finally, commitments of gold futures traders are following the same pattern profile as 2016; the producers and swap dealers are maximally short gold, while the managed money (momentum players) are maximally long. In 2016, this setup did not work out so well for the managed money guys, and we think the same thing is going to happen this time around (chart below).
The 2016 pattern replication is consistent across several markets. There is no guarantee that the pattern will continue to replicate. However, its cross-market presence makes it a better-than-random chance that gold will continue to melt down like it did in 2016. To take advantage of this idea, one could buy put options on GLD and GDX (put options limit potentially infinite losses inherent in outright shorting), or buy short gold ETFs such as ProShares UltraShort Gold ETF (NYSEARCA:GLL) or VelocityShares 3x Inverse Gold ETN (NASDAQ:DGLD) – keeping in mind that leveraged ETFs can be extremely volatile.
During the 2018 correction, our analysis showed that we were not at the start of a new bear market and that the bull market was not in the process of ending.
“I have not seen this type of analysis anywhere else. Please keep up the awesome work! – James”
“Happy ANG subscriber here. I believe them to be the best broad market analysts on seeking alpha.”
“Best here in seeking alpha are @Mott Capital Management and @ANG Traders . Best of the best!“
Mozart’s emperor said “too many notes”. I say “too many charts”.
https://youtu.be/jPhK1Xf6dAw?t=13
Ira’s metals
I see very little reason to expect $gold to pullback like it did following the 2016 high.
In fact, I see good reasons for it not to. It is technically on MUCH better footing this time in every way — re: strength, moving averages, big picture (monthly, quarterly, yearly).
Pulling back significantly versus TBT makes more sense since the dollar is being sacrificed to prop-up the bond market but I doubt very much that it will pull back nearly as much as it did the last time.
GLD:TBT weekly:
https://stockcharts.com/h-sc/ui?s=GLD%3ATBT&p=W&yr=4&mn=9&dy=0&id=p77729945743&a=707919891