
Steve Penny Provides Technical Analysis And Charts On The US Dollar, S&P 500, Gold vs The Dow, Uranium, and URNM

Steve Penny, Publisher of the SilverChartist Report, joins us to share a number of key charts on the US Dollar, S&P 500, Gold:Dow ratio, Uranium, and Uranium Miners. (all posted below so you can follow along).
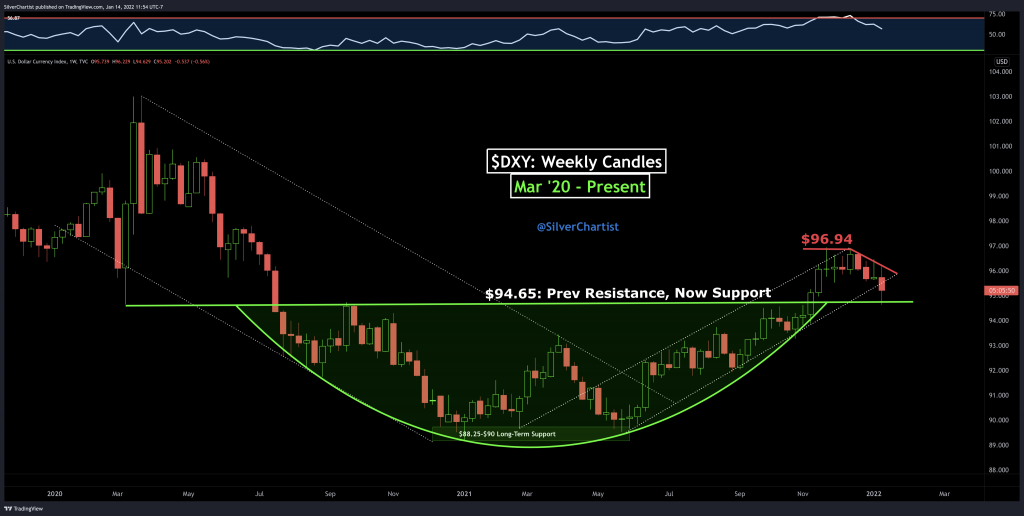
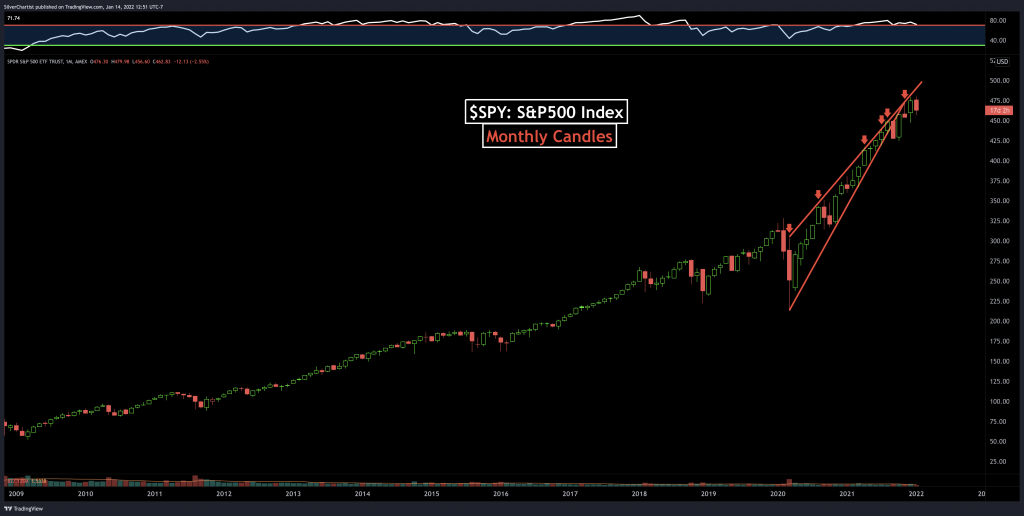
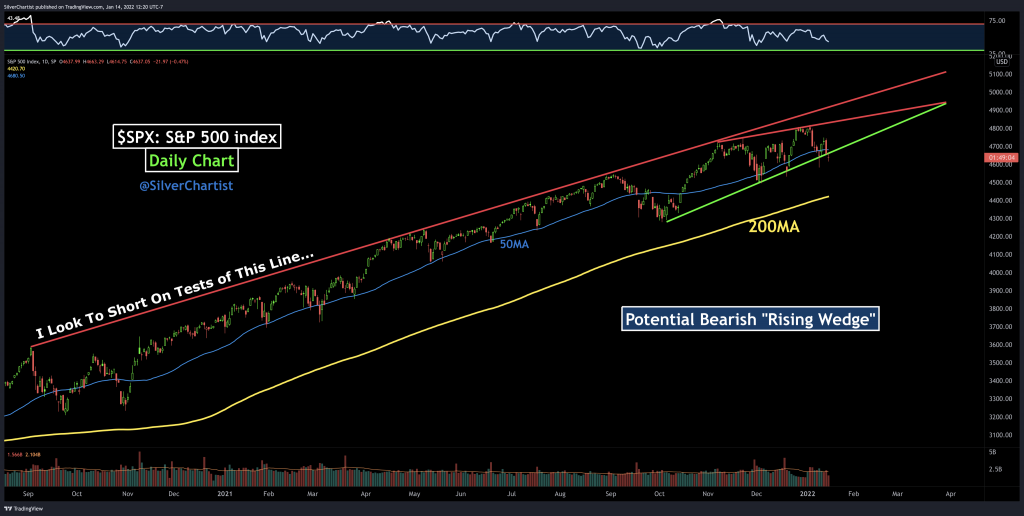
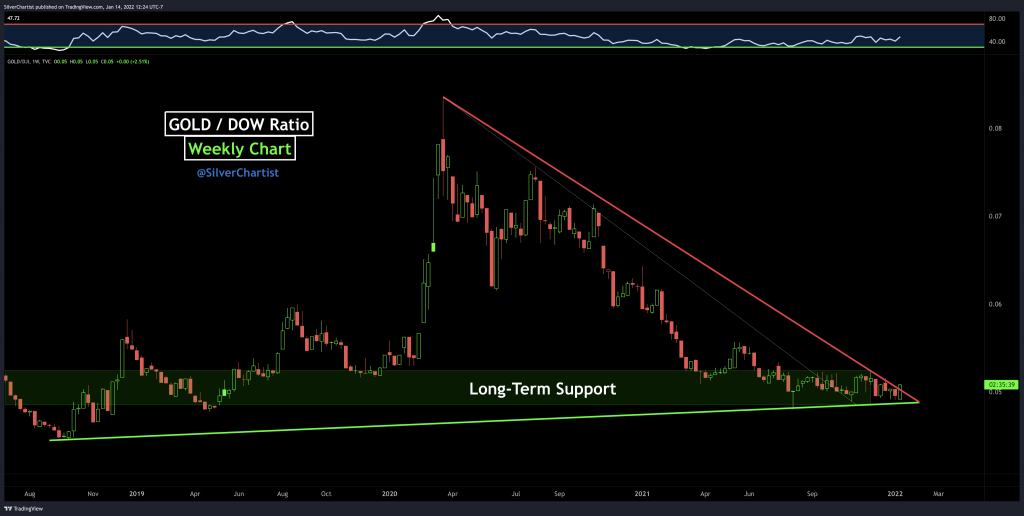
We start off with getting Steve’s insights on both the US dollar chart and discuss how it doesn’t necessarily need to correlate to the directional movements in gold, but instead is merely a headwind or tailwind. Next, we review the longer-term bullish chart of the S&P 500 (SPX) and how it may be close to key resistance, which could send it correcting down to the 200 day moving average. We then turn our attention to the gold : Dow ratio chart but also note how historically undervalued the whole commodities sector still is compared to general equities or most other asset classes.
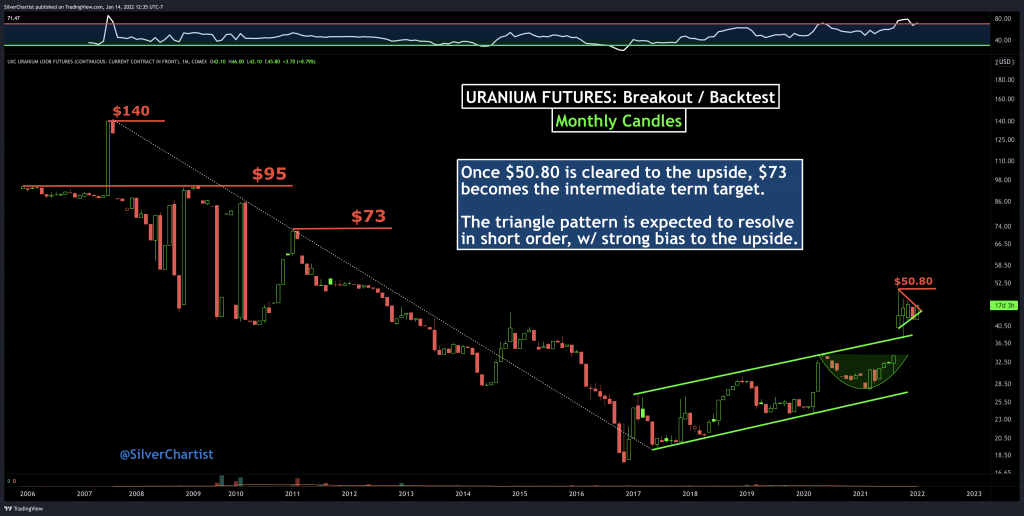
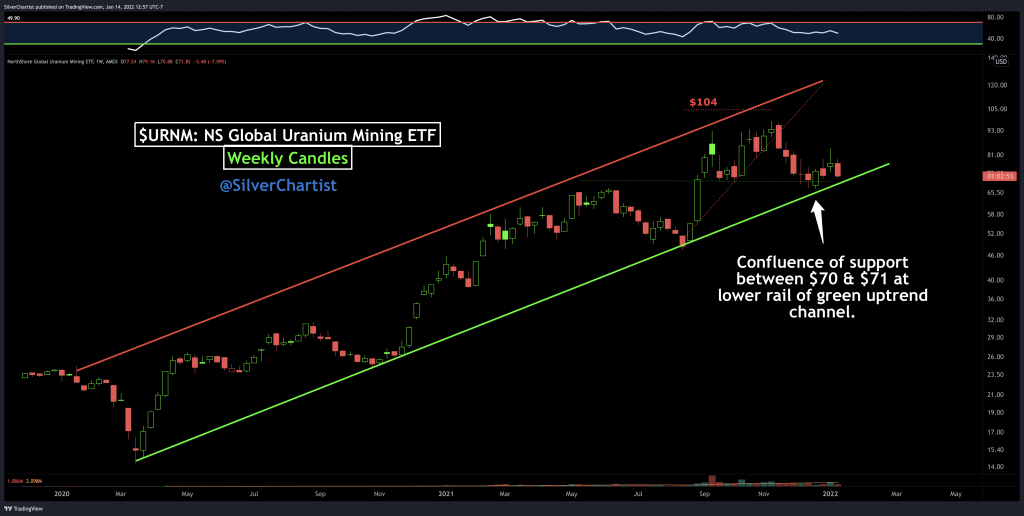
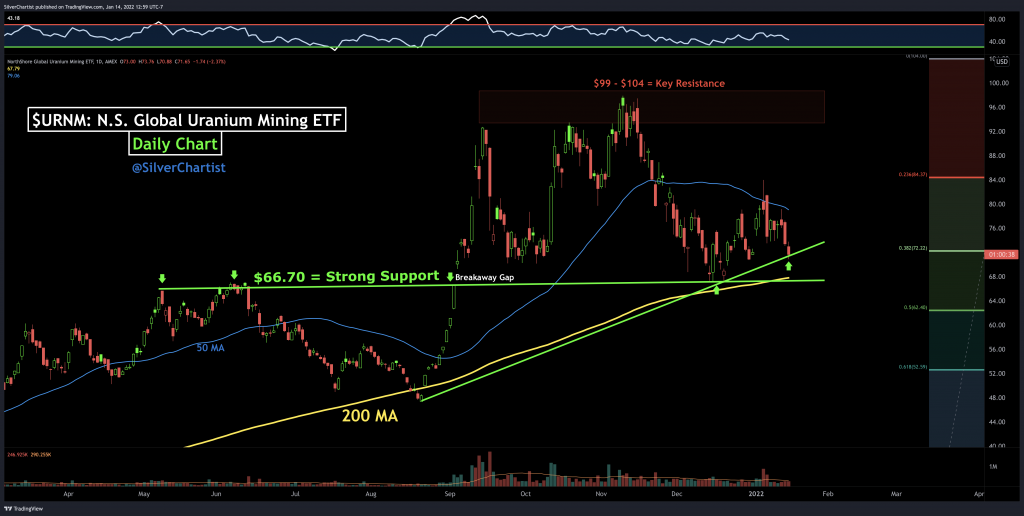
Steve then breaks down the uranium price chart, where he sees plenty of upside left in the medium-term for it to make a measured move up to overhead resistance at $73 per pound. We wrap up with a look at the and the NS Global Uranium Mining ETF (URNM), where Steve believes the outperformance of the stocks to the underlying metal over the last 2 years was just a reversion to the mean, and that the recent corrective move to trendline support is probabilistically just building the base for the next move higher in uranium equities.
Click here to visit the SilverChartist website and sign up for Steve’s free email list. That is the best way to get a handle on Steve’s research.
Gold Lagging Inflation
.
Adam Hamilton – Jan 14, 2022
.
“Gold is lagging the raging inflation unleashed by the Fed’s epic money printing. Despite leading inflation benchmarks skyrocketing to multi-decade highs, gold prices have barely budged. Serious inflation initially fuels record-high stock markets, which stunt gold investment demand. But festering inflation increasingly erodes corporate earnings, hitting stock prices. As stock markets roll over, gold will start reflecting this inflation.”
“Runaway inflation is increasingly plaguing the United States, as evident in this week’s major economic releases. The December Consumer Price Index headline number came in up 7.0% year-over-year, its hottest print since June 1982! That’s a 39.5-year high, despite the CPI being intentionally lowballed by the government to mask inflation. Fast-rising general prices slash standards of living, angering American voters.”
.
http://www.321gold.com/editorials/hamilton/hamilton011422.html
Steve Penny – 7% Inflation & Major Shift In Markets
.
Liberty and Finance – January 12, 2022
.
“Silver and gold jumped after news of inflation rising to 7% for December. Analyst Steve Penny says metals are signaling the Fed is not going to follow through on tightening. He sees the Fed will reverse course, which will be further “rocket fuel” for gold and silver.”
.
0:56 Metals rally
1:54 Gold update
3:19 Silver update
3:57 Platinum update
5:18 Miners
7:06 Stock market
9:59 USD Index
11:30 National debt
.
https://youtu.be/nvUp9rnJ628
Gold Markets Carving Out a Consolidation
.
Christopher Lewis – Fri, January 14, 2022
.
“If we can break above the $1835 level, then I think the market really starts to take off and it goes looking towards the $1875 level. Alternately, if we break down below the $1780 level, that would be extraordinarily negative for gold.”
.
https://www.yahoo.com/finance/news/gold-markets-carving-consolidation-170910360.html
Uranium Market Minute – Episode 63: SPUT, YCA, ANU – Secondary Demand
.
Uranium Insider – Jan 14, 2022
.
https://youtu.be/9XVzWwsuM6M
Rick Rule: “Sprott Uranium Price Outlook For 2022” // Uranium Market, Investment, Economy
.
LifeWorthLiving – Jan 13, 2022
.
https://youtu.be/BhDJzuZbXxA
Can some one tell me why gold analyst talk about cup and handle in gold and ready for big breakout when the dollar chart shown above also looks just like the cup and handle of gold, gold and dollar can move higher together but not if gold is going to $2500 then dollar has to go down towards $89 for that to happen.
So my point is how can you tell on cup and handle charts.
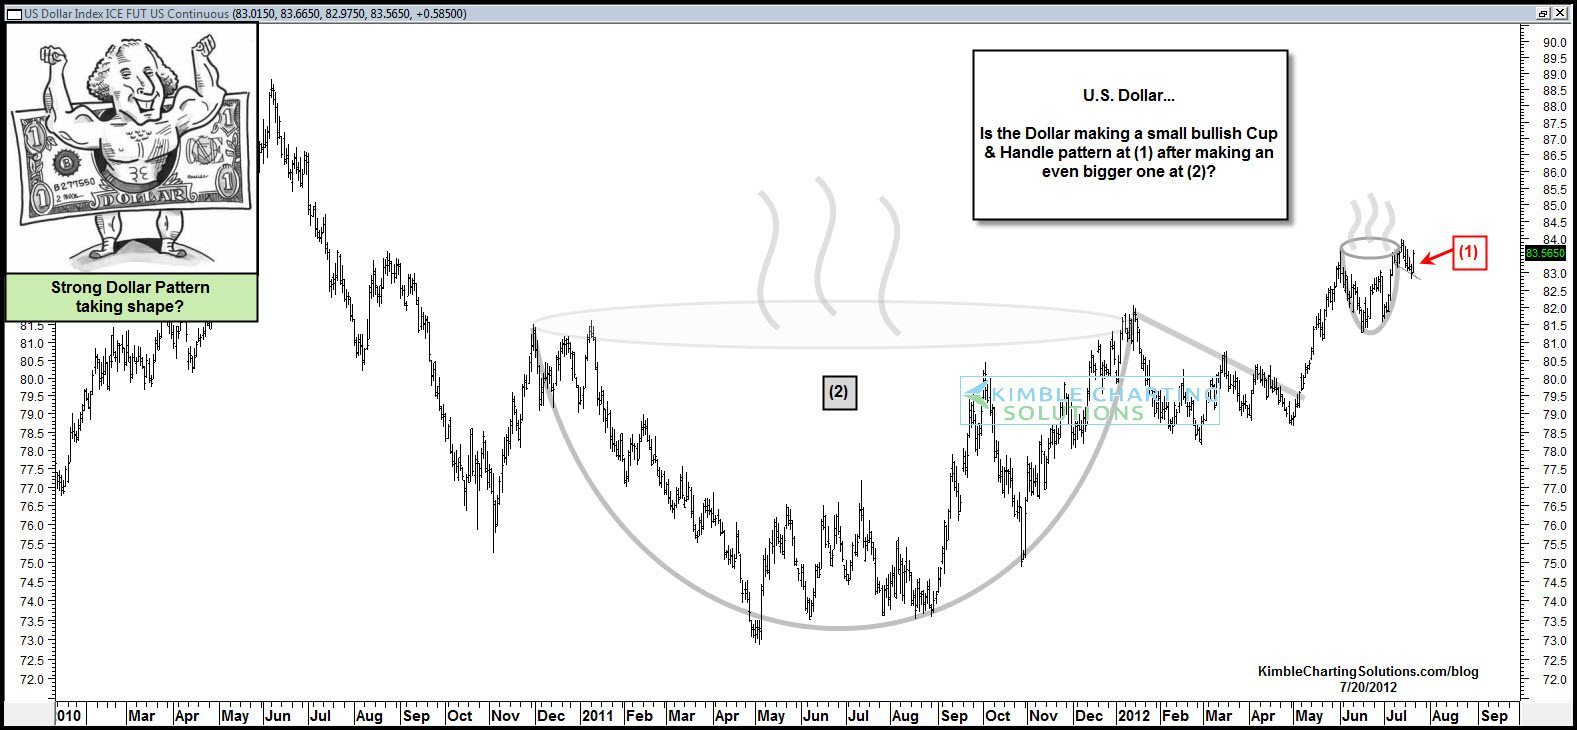
Paul – That’s a valid point about the cup & handle pattern on the US Dollar, and one that Chris Kimble has pointed out over at his site.
.
>> Here is a chart from Kimble Charting Solutions reviewing that Dollar C&H pattern for review:
.
https://kimblechartingsolutions.com/wp-content/uploads/2012/07/dollarsmallcupandhandleafterbigonejuly20.jpg
The dollar index doesn’t have to go anywhere in particular for gold to go to 2500. Remember that the USDX was about 72 when gold hit 1000 in 2008; so why wasn’t it 36 when gold hit 2000? The answer is simple: The USDX is a useless measure of the dollar’s purchasing power.
Today, the dollar index is about 33% above its 2008 low yet it did not go up one bit in purchasing power. In fact, it buys much less than it did back then. The USDX is up because the dollar buys more euros than it did in 2008 and it only does that because it has fallen less than the euro in purchasing power.
Agreed 100% Matthew. The USDX, as we’ve mentioned many times, is just how it is floating in relation to other Fiat currencies also falling in their purchasing power, but has nothing to do with the Dollar’s actual purchasing power. Steve Penny also made that same point in the interview up above in response to Cory’s question about the dollar index “strength” last year and weakness so far this year.
.
With a 7% inflation reading in December, it should be getting pretty obvious to most consumers that their dollars purchasing power is steadily being eroded (regardless of what the dollar index shows in relation to other fiat currencies).
Paul,
Those are not cup and handles in the usd although they do look like cups.
Pull out if you can a 80 year or 100 year US dollar chart and you will notice it’s trajectory. It slopes down like a ski hill and when it has rallied for extended period it creates cup like structures. However and this is a big however draw the line down the sloping chart and connect the dots and you will see the dollar is making lower highs and lower lows for decades now. We are at the brisk here and now and as Matthew said we can rally for few days etc but really we both know the dollar is toast and I feel quite certain the Cad will take over from here and the miners and metals will follow.
Call me optimistic but really I’m being realistic when I say Cad can hit .85/.86 in 3/4 months and done let me tell you what I think by December.
Cheers
Waiting for the Pivot
.
John Hathaway – Wednesday January 12, 2022
.
“Shrinking mine supply, robust physical demand, minuscule interest rates and the advent of problematic inflation failed to generate an advance in the gold price in 2021. Gold bullion declined 3.64% in 2021, while gold mining stocks fell 9.25%.1 What stymied interest in precious metals over the past twelve months was the lure of strong equity market returns, the prospect of tighter monetary conditions and an infatuation with all things crypto. We expect things to be different in 2022.”
“The bullish setup of supply and demand for the physical metal will, in our opinion, start to attract notice…”
.
https://sprott.com/insights/sprott-gold-report-waiting-for-the-pivot/#