
Commodities And Resource Stocks Update: Uranium, Gold, Silver, Nat Gas, and Oil

Excelsior Prosperity w/ Shad Marquitz

There are so many things to comment on in this update with regards to the commodity sector and specifically in the junior resource stocks that so many readers here invest in. That means that unfortunately there just isn’t much time or space to weigh in on the different macroeconomic developments like the recent inflation readings, Fed funds rate cut expectations, labor markets, retail sales, consumer confidence, manufacturing, the US dollar, interest rates, etc. Sometime soon we’ll get back into all of that, but there are more pressing matters at hand.
It should also be noted that the general weighted US stock indexes like the S&P 500, Nasdaq, and DOW keep pushing up to or near all-time highs, and many international markets are rallying, giving generalist investors little reason to pay attention to the resource sector and the beleaguered mining stocks or energy stocks.
So even though it does seem pretty dismal out there for resource investors, it is interesting that there are a continuously growing number of people starting to read these articles and tune into our podcast interviews over at the KE Report. There also seems to be quite a few people making the trek out to PDAC next week in Toronto, despite all the carnage. So while you may feel all alone in these investing vehicles when every other headline is about artificial intelligence and tech stocks and cryptocurrencies continuing to rally, there really are a growing number of people watching the resource space intently to see where the bleeding will stop, and where the turn will come. So let’s get into it…
Uranium Mining Stocks Update:
It is important to note that most of the uranium stocks were, in fact, magnetically attracted to the 50-day exponential moving average as postulated earlier in February in an article titled “Uranium Remains Commodities King Of The Mountain” and then highlighted again in the last article I put out on this sector over a week ago.
- Special Alert – Uranium Stocks Magnetically Drawn To The 50-Day Moving Average
https://excelsiorprosperity.substack.com/p/special-alert-uranium-stocks-magnetically
Now inside that special alert linked above, I had pointed out that while most of the uranium stocks were either at or pulling back down near their 50-day exponential moving average (EMA), that the largest North American uranium producer, Cameco (CCO.TO) (CCJ) had actually sliced down through this prior support, and it would be important to see if it was a leading signal for the rest of the sector. (It turns out that it was)
- Here’s what I wrote again for quick reference:
“Sometimes a tool will work for a while, until something different changes and overwhelms it. For example, just look at the largest North American uranium producer, Cameco (CCO.TO) (CCJ) as a company that has just sliced right down through it’s 50-day EMA like a hot knife through butter.”
“This brings to mind the adage, ‘The trend is your friend… until it isn’t.’ So in this case, the Cameco daily pricing was respecting the 50-day EMA for the most part over the last year, with a few small dips below it, but this recent action is a decisive break below it. This will be important to watch, as it could be a canary in the uranium mine for the rest of the sector, if they all follow suit.”
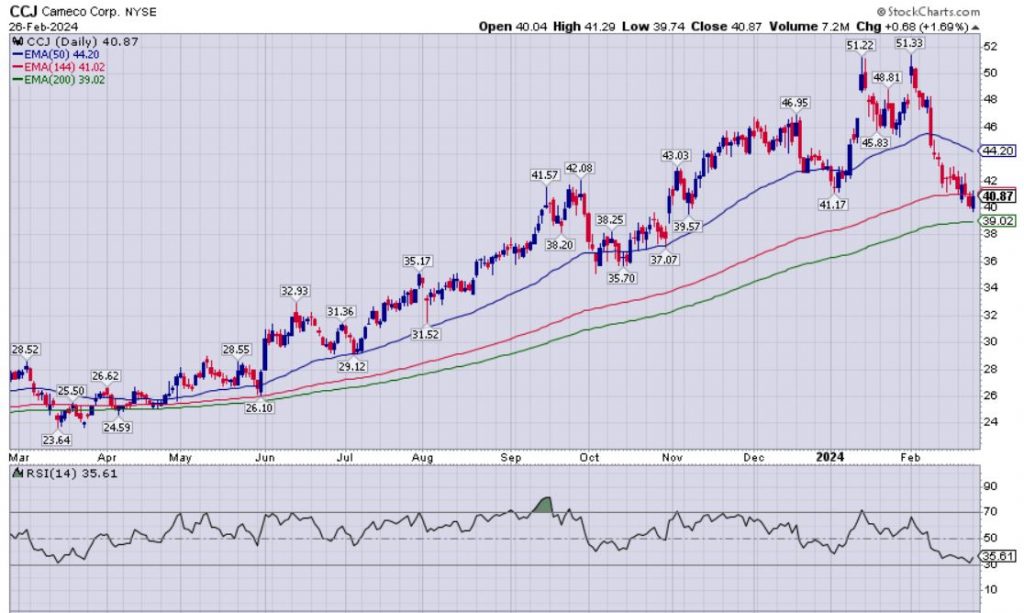
If we look at the 1-year daily chart for Cameco on (CCJ) above it is easy to see that more or less, it was respecting the 50-day EMA (blue line) over the last year. However, then it totally fell out of bed over the last 2 weeks, crashing below the 50-day. Then it went down further to break below the Fibonacci support level of the 144-day EMA (currently at $41.01 show by red line), and it appears it has acted as overhead resistance the last 2 trading sessions on Friday and Monday. Next support down below is the 200-day EMA (currently at $39.02). The Relative Strength Index (RSI) down below the chart is at 35.61, so still not quite in oversold territory (typically triggered by a reading below 30 or lower), so maybe pricing will keep moving towards the 200-day after all before getting overbought enough to bring in more buying.
- The 200-day moving average (both the simple and exponential) are fairly widely utilized support areas on charting, so it will be interesting to see if it gets tested and if it holds. Stocks trading above their 200-day moving average are considered still in a bullish posture, whereas stocks trading below their 200-day MA are considered in a bearish posture. We are getting closer to this level in Cameco and so we’ll have to keep a close eye on how the pricing action resolves from here.
Now let’s quickly look at just a few other uranium stock charts that show a similar pattern where they followed Cameco’s lead down below their 50-day EMAs as well. Note the 144-day Fib level EMA, and 200-day EMA levels as potential areas of support on the following charts:
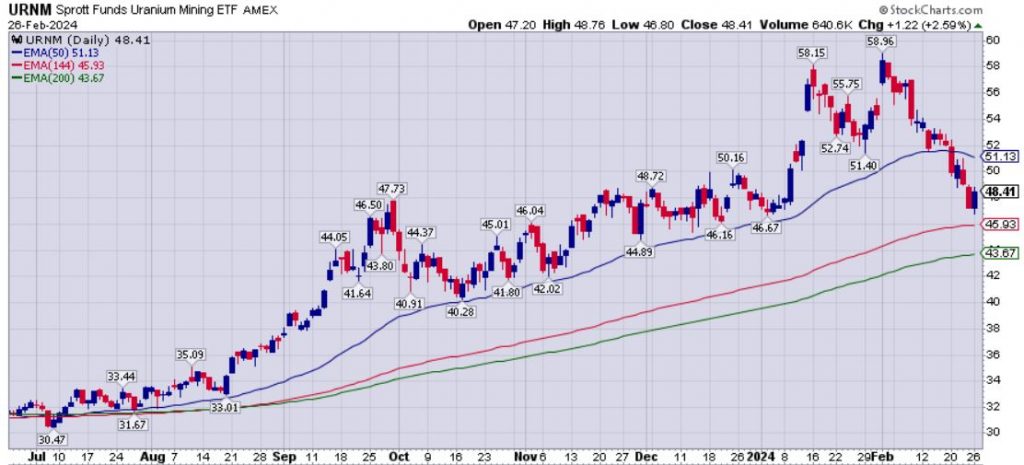
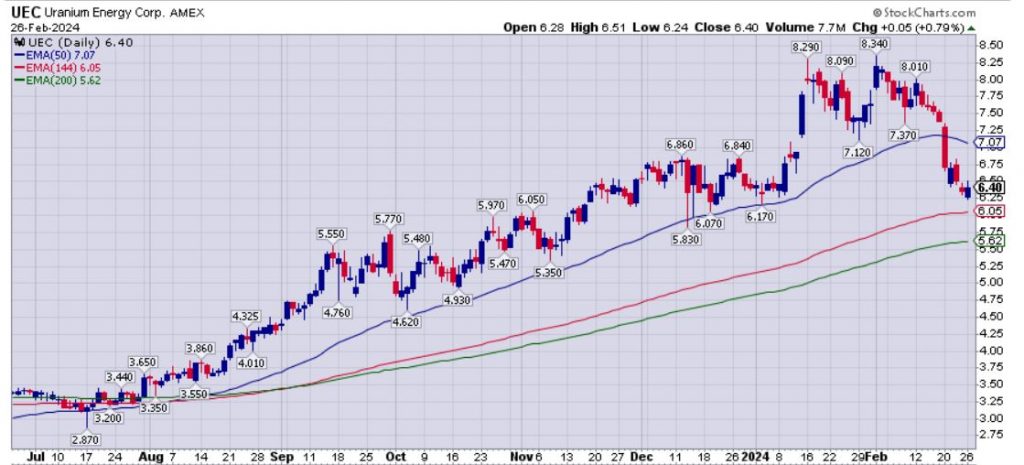
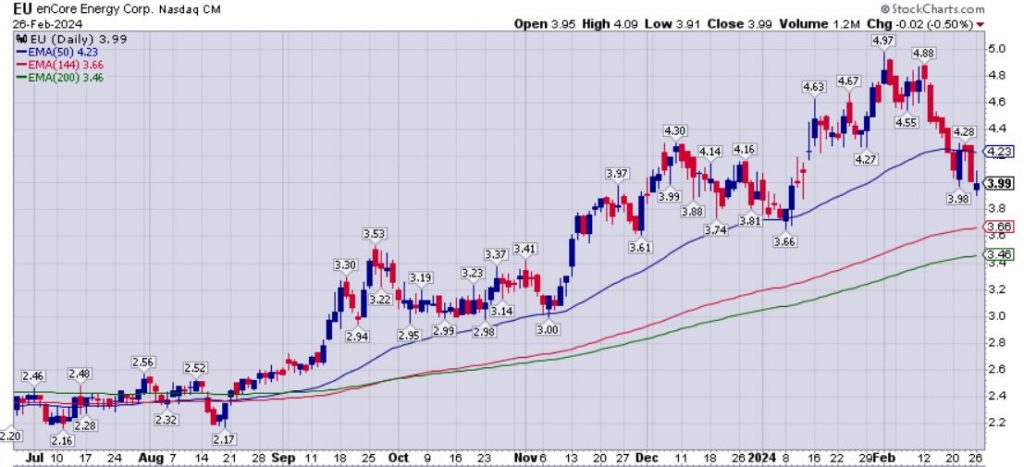
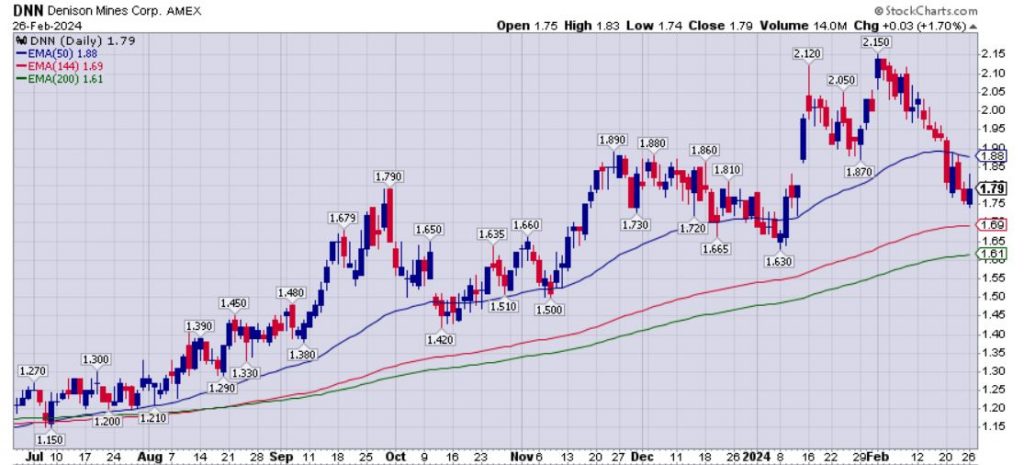
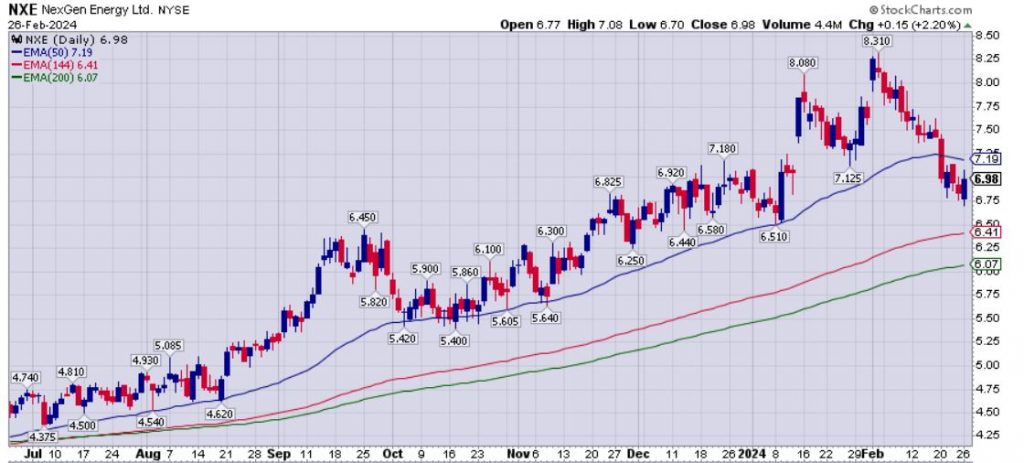
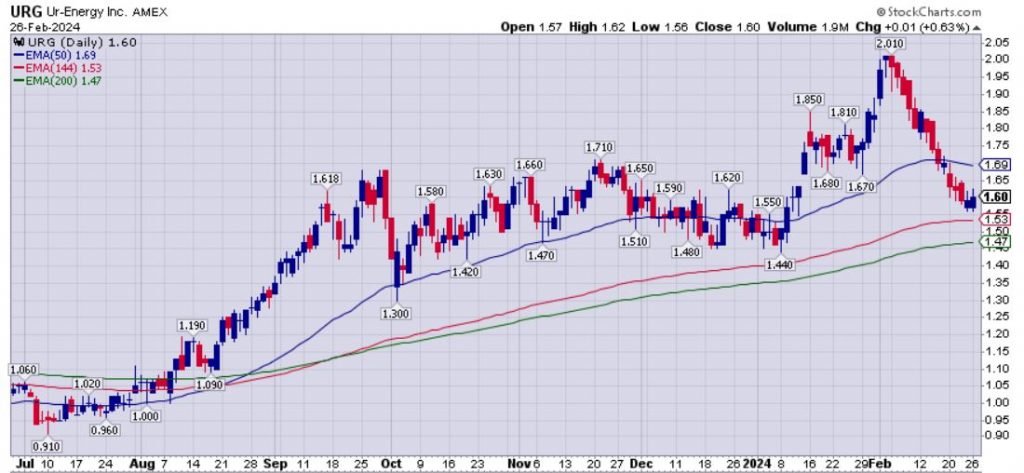
Did anything suddenly fundamentally change with all these uranium stocks over the month of February where they should have suddenly given up a big chunk of their pricing gains and market caps we saw kicking off the month of February? No, not really. They all moved in tandem, and have very similar charts, despite all the unique micro drivers and fundamental differences from company to company.
Now, some of this similarity in trading was likely influenced by the ETF selling pressure in URA, URNM, and URNJ as many of these stocks were included in those funds. It would be fairly subjective to say it was all because Cameco mentioned they were going to try to bring on more supply in the year(s) to come, which is what caused the sector leader to break support first. It looks like a game of follow the leader, where when it broke technical support at the 50-day EMA first and headed down to the 144-day EMA, that the rest of stocks followed suit doing the same exact thing and plunging even lower over the last week. It likely amounts to a lot of investors or funds ringing the register after a blistering move higher, and as mentioned in prior articles, I too had pulled 20%-30% profits in a number of names the end of January and early February, feeling we were overdue for a correction. Now I’m watching to see a few more trading sessions around the 144-day Fibonacci EMA, but ultimately, my sights are on the 200-day EMA for potential support to come into play and as a buying opportunity to add back to positions I trimmed. So we’ll watch that level, and update things again in a week or two once we know more.
Gold Still In The “Boring” Sideways Channel Consolidating Above $2000 On The Weekly Chart
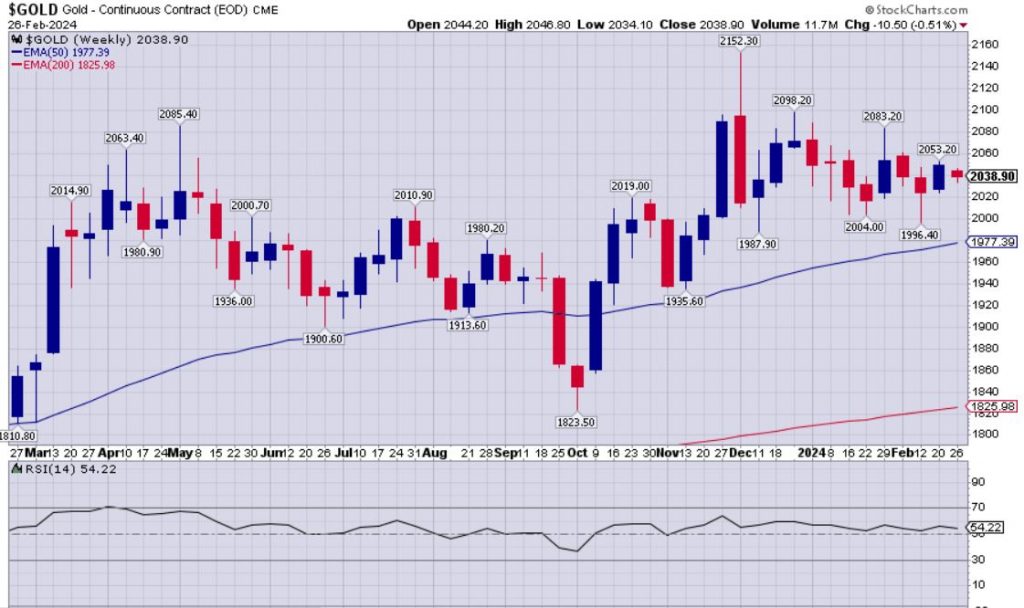
Gold futures have put in 15 weeks in a row since the 3rd week of November with weekly closes over the $2000 psychological level. What does that mean? Well, we can’t know what the future holds, but this is sure the stickiest we’ve seen the yellow metal hold above this level ever in pricing history, so it isn’t just a momentary blip higher this time around. It appears to be consolidating through time rather than through price, which is actually a constructive sign (because it could have dove down to the mid $1800s when the Fed rate cuts were postponed, but it didn’t). The RSI below the chart is not oversold or overbought currently at 54.22. So gold is in an overall neutral position and it is quite boring to most market watchers.
A sideways consolidation for the underlying precious metal is actually somewhat constructive, but boring sideways metals prices are like kryptonite for momentum investors and thus the gold mining stocks are getting weak once again.
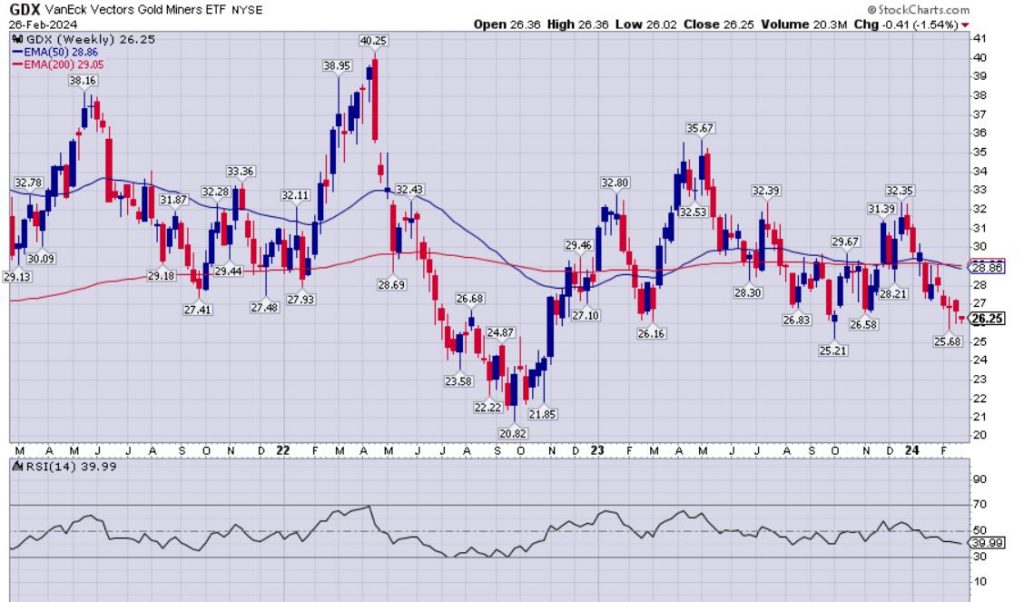
The bears are still in control here, with pricing closing today on Monday at $26.25, still well below both the 200-day EMA at $29.05, and the 50-day EMA at $28.86. Gold mining stock bulls will want to see GDX punch back up above both those levels in the weeks to come, and ideally see the 50-day move back up higher than the 200-day EMA to confirm a better bullish posture. Also, it would be bad to break below the recent February low of $25.68 or that next recent low from last October at $25.21. If that were to break then the lateral support at $23.58 from back in July of 2022 comes back into play, and then after that the $22 level from August & October of 2022, with the ultimate line in the sand being $20.82 from September of 2022. That would not be a fun experience to retrace back to those levels, so let’s see if GDX can start to dig out from the current pricing and head back up towards the $29 area.
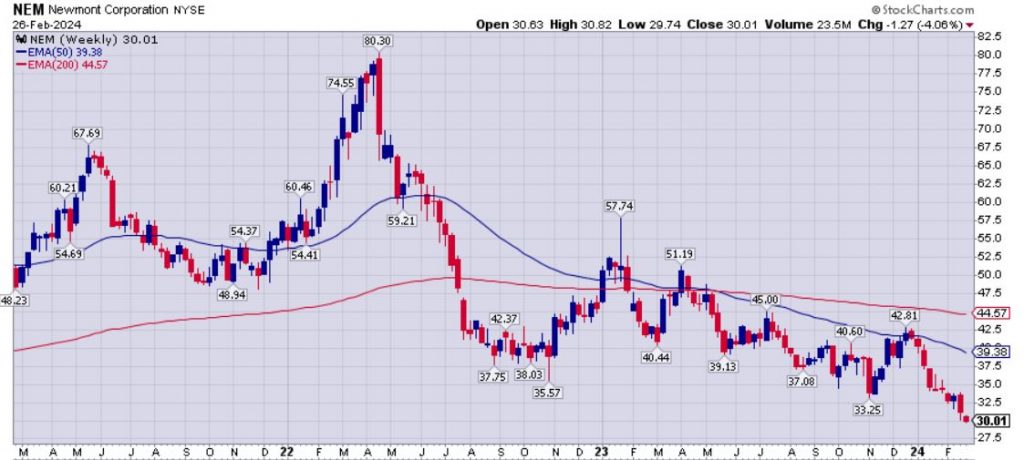
There have also been some individual stocks like sector leader and largest publicly traded gold producer, Newmont Mining (NEM) that has continued to suck wind, and is definitely not encouraging generalists to get remotely excited about getting positioned into gold mining stocks.
There are a few other gold mid-tier producers that have also taken it on the chin lately, that are on my list of growth-oriented gold producers like Equinox Gold (featured last time in Part 4 of that series) and Argonaut Gold (that I’ll go ahead and feature in the next one now that it just dropped 34% yesterday alone… and is down another 6% today. Yikes!). Stay tuned for that update soon.
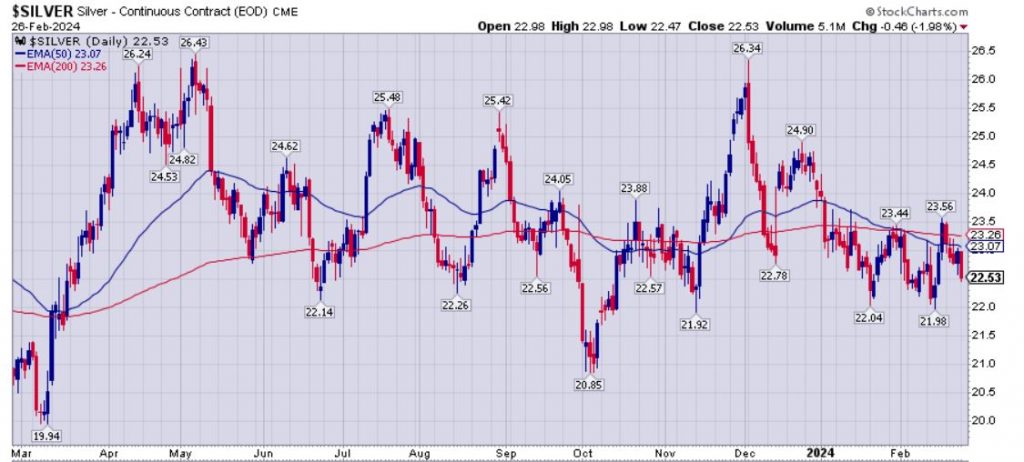
Silver futures prices, still boring us all to tears… still a whipsaw pricing market channeling sideways… still slightly a bearish bias with pricing mostly below both the 50-day and 200-day EMAs for most of this year. Bulls will want to see Silver blast up definitively and close above both those moving averages for a few days and weeks to get the momentum going more bullish. Until then it remains lackluster.
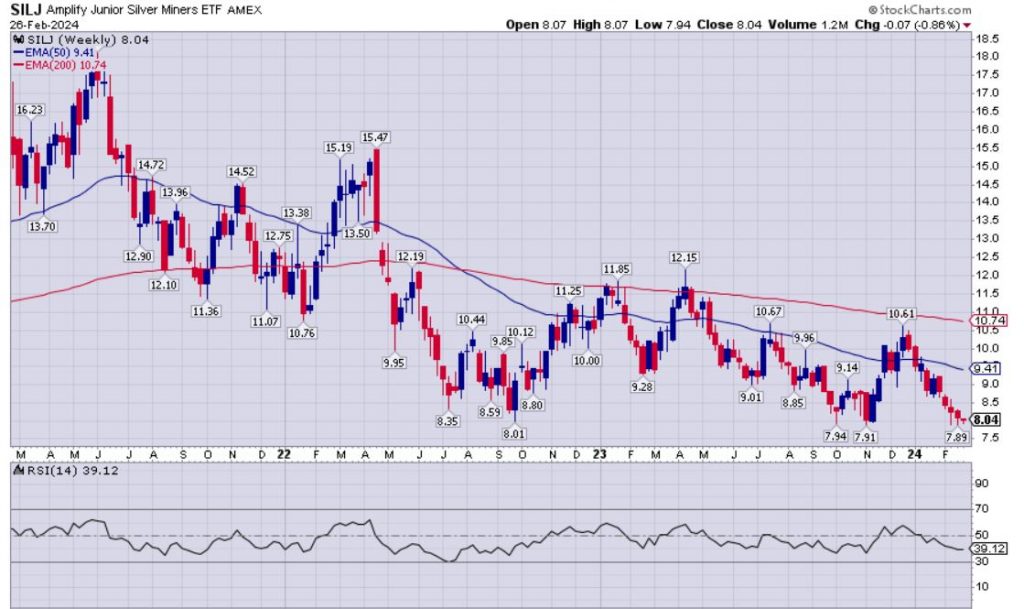
SILJ remains one of the most fugly charts in the precious metals complex as far as the metals and PM ETFS. It’s way below the 50-day and 200-day EMAs, it just made a new lower intraday low last Friday at $7.89, which is lower than the 2 most recent lows at $7.94 and $7.91 (from Oct/Nov of last year), which were lower that the $8.01 level hit in September of 2022 (when Silver was down at $17.40). It is very concerning that the silver stocks are getting valued even lower than that period of time, with the metal $4 higher than it was then. Bulls need to see something get moving in this soon to reclaim some prior peaks and the overhead moving averages, but so far there is nothing on the SILJ chart to get overly excited about.
Nat Gas – The Widow-Maker Continues To Live Up To It’s Name
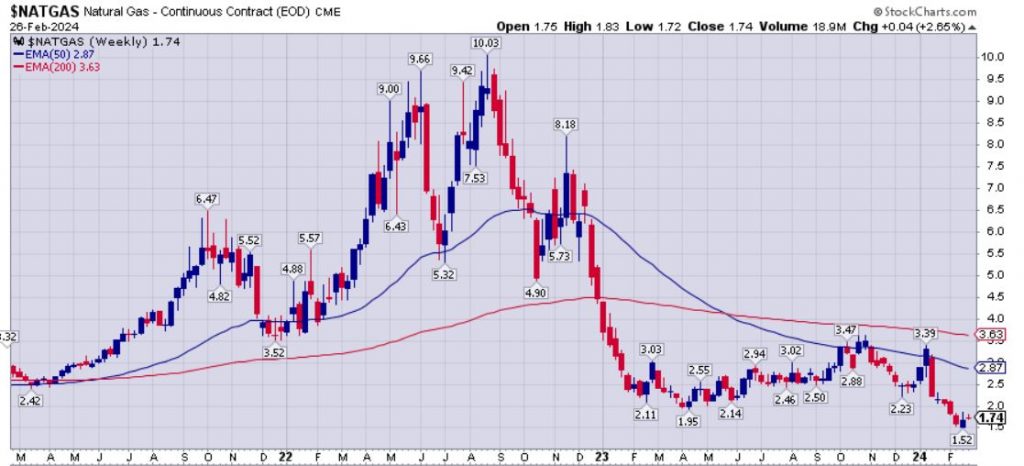
As remarked a few weeks ago, it was not looking overly bullish for Nat Gas, and those investors trying to catch the falling methane gas knives in the mid to low $2s over the last year, had to have been nimble to exit in the mid $3s last October or again in early January, or they’ve just been further cut to pieces, with nat gas making an intraday new low down to $1.52 on Fridays trading session before rebounding a bit into the close, and then closing today on Monday at $1.74.
We had a great interview over at the KE Report on our Weekend Show with Dan Oliver where we all spent some time on natural gas fundamental and some of the gasser stocks he likes for those contrarians looking to buy some of these energy stocks while there is blood in the streets.
- Rick Bensignor and Dan Steffens – Portfolio Management: US Markets, Gold, Oil and Natural Gas Stocks
- (this hotlink should jump listeners to that section of the weekend show at 25:10)
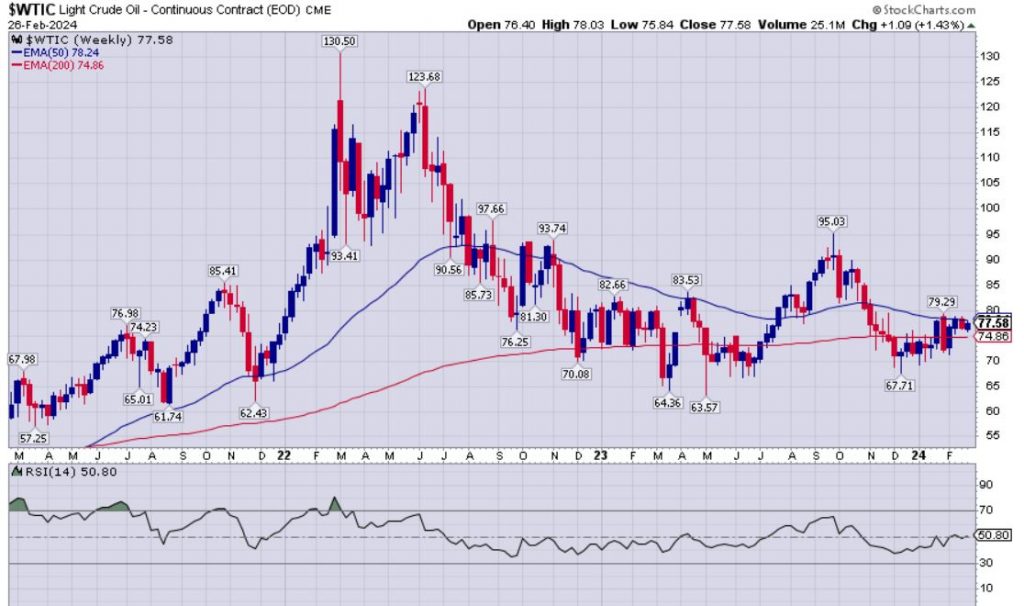
As far as WTI oil pricing, it has been almost as boring as gold and silver lately, also channeling sideways in a whipsaw price channel in the mid to high $70s, irrespective of geopolitical turmoil, supply/demand drivers, OPEC+ messaging versus reality, etc… WTI closed today at $77.58, right in between the moving averages that are starting to converge closer together; below the 50-day EMA currently at $78.24 and yet above the 200-day EMA currently at $74.86. The energy is compressing here and it’s getting ready to make a big break one way or the other in the near future. Whether that is up into the $80s or down into the $60s remains to be seen, but which ever way it goes, it is likely to have some solid momentum for a few months.
So, overall, some of these key commodities have been rather boring, and the resource stocks have been under pressure, with even uranium stocks now joining the rest of the herd in corrective moves. This is all playing out with the backdrop of US equity indexes, tech, artificial intelligence, and cryptos surging higher. These are tough times to be heavily invested as a resource stock speculator, and there has been an opportunity cost to being overweight this sector and underweight the broad averages for sure. There isn’t much more to say other than this too shall pass, and this is the importance of having a diversified portfolio.
Thanks for reading and wishing everyone positioned in these resource stocks the patience to endure the further pain, so that eventually we make it to the outsized gains. I wish there was something more positive to review, but I’m not going to sugarcoat the tough slog we’re all going through collectively.
One thing we can look forward to though, is that with the BMO conference going on in Florida right now, and PDAC set next week, there should be a flurry of newsflow on tap from the resource stocks, so stay tuned for any breaking news and updates over at my Substack page.
https://excelsiorprosperity.substack.com/
Ever upward!
– Shad