
Energy Commodities Update – Excelsior Prosperity W.I.R. – Part 8C

The overall pricing and fundamental trends in motion for the commodities have remained in motion, for the last few weeks. At first glance, there aren’t any wild divergences, breakouts or breakdowns from those trends to report on. However, we’ll take a look here at some of the fundamentals and charts for a few of the energy commodities that have the most action and interest in their related resource stocks.
On Saturday, there was already an update released on the Uranium market and the U-Stocks here on this channel. Even in that article, I was only able to squeeze in a few company thoughts, updates, and charts; after spending the bulk of it unpacking some of the fundamental drivers in the continued trend higher in the spot and term pricing, and the technical setup on my favorite ETF to track the sector equities (URNM). There is just so much to cover in the energy commodities space.
Excelsior Prosperity – Uranium Remains Commodities King Of The Mountain – Week In Review Part 8B
https://excelsiorprosperity.substack.com/p/excelsior-prosperity-uranium-remains
- In this Part 8C – Energy commodities update, let’s stick with taking a closer look at Oil, Natural Gas, the oil & gas stocks, Lithium, and the lithium equities.
- Part 8D will be out soon – focused on the Gold, Silver, and Copper putting the focus back on the precious metals and the good doctor in the next few days. That is simply going to be too much information and too many charts to include in this particular update, as was initially intended.
Oil Price Still Stuck In A Malaise:

We all hear and read so many competing opinions on the oil markets about these times being “peak oil” production, and then back to the converse that the world is about to be awash in too much oil. Then additionally we’ve heard for a long time the often touted “fossil fuels are being phased out over the next decade.”
Those narratives have been in place for decades now; and so far, we’ve not seen peak oil, and oil was surely was not phased out (with over 2,000 commercial uses) in the 2000s, or 2010s, and not so far in the 2020s. It is also quite debatable whether or not we are going to see the opposite scenario and simply be awash in too much oil for a sustained period of time. Black gold is still the key energy commodity input, and at least for now, the world still runs on oil.
Drilling down (pun intended) into the oil supply side, it is like a game of ping-pong reading the IEA and EIA inventory builds or declines from month to month, and parsing all the business/geopolitical comments on OPEC+, Russia, the US, South American supply, the effects of Iran and Venezuela, issues in the Panama Canal, issues in the Red Sea, etc… We could line up a dozen oil bulls and oil bears, and even moderates in the middle, and they could highlight different data points to make their case, and none of them would have the same outlook for where the trends are heading So… we’re not going to go there there today. Instead, I’m just going to look dispassionately at the charts through the end of last week; which contain the sum of all fundamental factors cooked into the daily and weekly pricing closes.
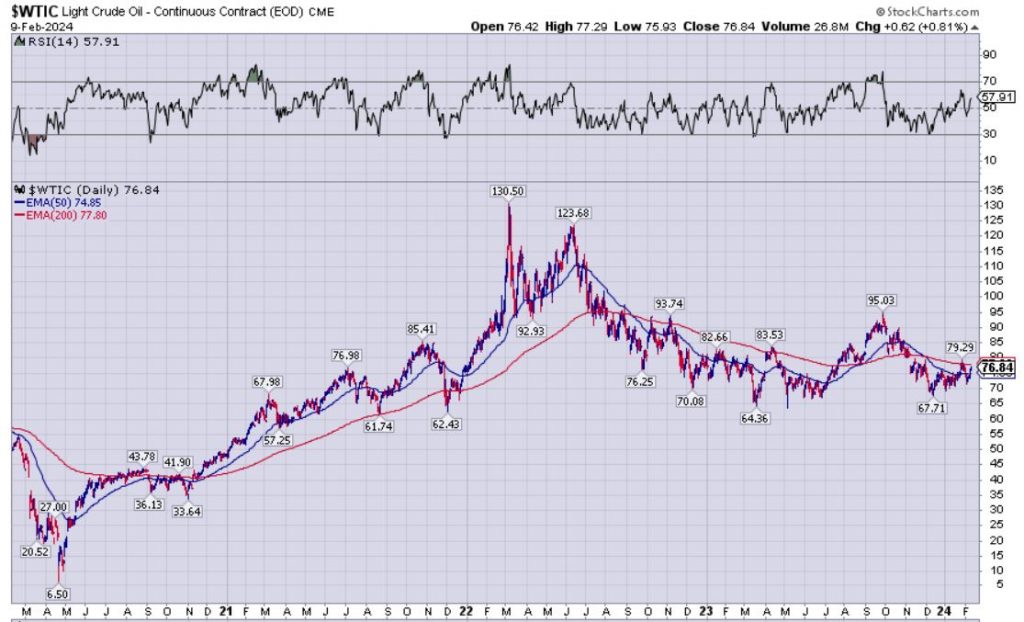
It is interesting to look at this 4-year daily price chart of WTI oil looking back to how the narrative quickly shifted from it going briefly negative on the futures charts, but displaying here as that dip down to $6.50 back in April of 2020, and then vaulting all the way up to $130.50 during the Ukraine conflict heating up in March of 2022. In the middle period during 2021 the pricing was more in a range between the mid $60s to the mid $80s. Low and behold, that is the same basic range we saw in 2023, with a low of $64.36, and (barring the brief spike up to $95 on the Israel/Hamas conflict in the Middle East) the prior peak at $83.53 and the next minor peak at $84.89. Back in November oil dropped back down to $67.71, and in January got back up to $79.29 before reversing back down.
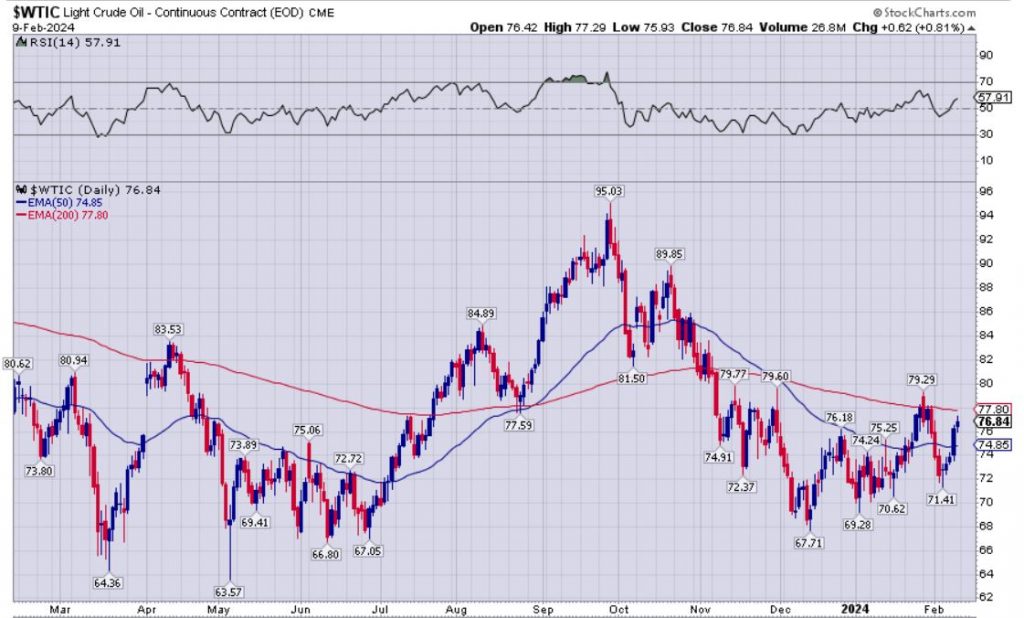
This has mostly been a story of range-bound trading, and there is no indication that anything radical is going to break it out of this anytime soon. Oil closed last week on Friday at $76.84, slightly above the 50-day exponential moving average (EMA) that is currently at $74.85, and slightly below the 200-day EMA currently at $77.80. While the bias has been slightly to the downside, the pricing action is all converging in the mid to high $70s.
Could WTI oil pricing finally break up in the $80s or break down into the $60s… sure, but is that really changing or challenging the range it’s been in from the mid $60s to the mid $80s for much of the average pricing over the last few years… Nope. Other than the anomaly of the break higher on geopolitics last Sept/Oct, it has been more of a steady and boring pricing channel. Now on shorter timeframes, the whipsaw action is actually a great market to swing-trade or position trade playing the ranges; but just not necessarily ideal for the longer-term “buy and hold” type of investors.
Natural Gas Keeps Diving Lower And Retains The Title Of “The Widow-Maker”
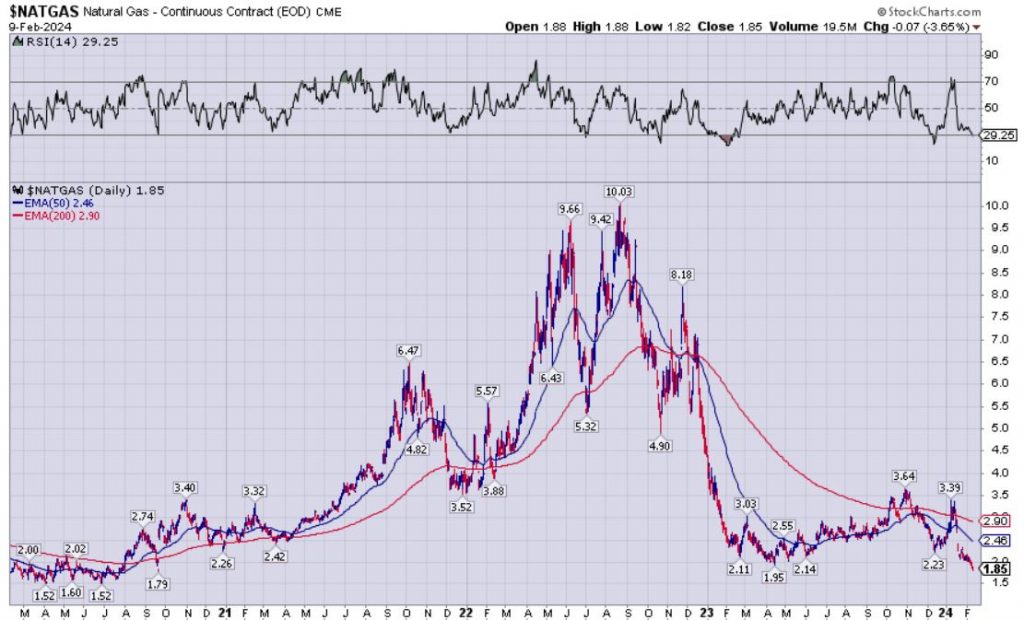
Just when nat gas investors thought it was safe to get back in the water in the mid to low $2’s, it cratered again into the high $1’s, with futures closing last week on Friday at $1.85. We are now back in the realm and range of pricing seen during the key months of the pandemic back in mid-2020, due to large supply builds. Hopefully this trade has not killed too many portfolios of energy traders, but one can see the case for speculating on that elusive contrarian nat gas rally (like we saw in December heading into early January).
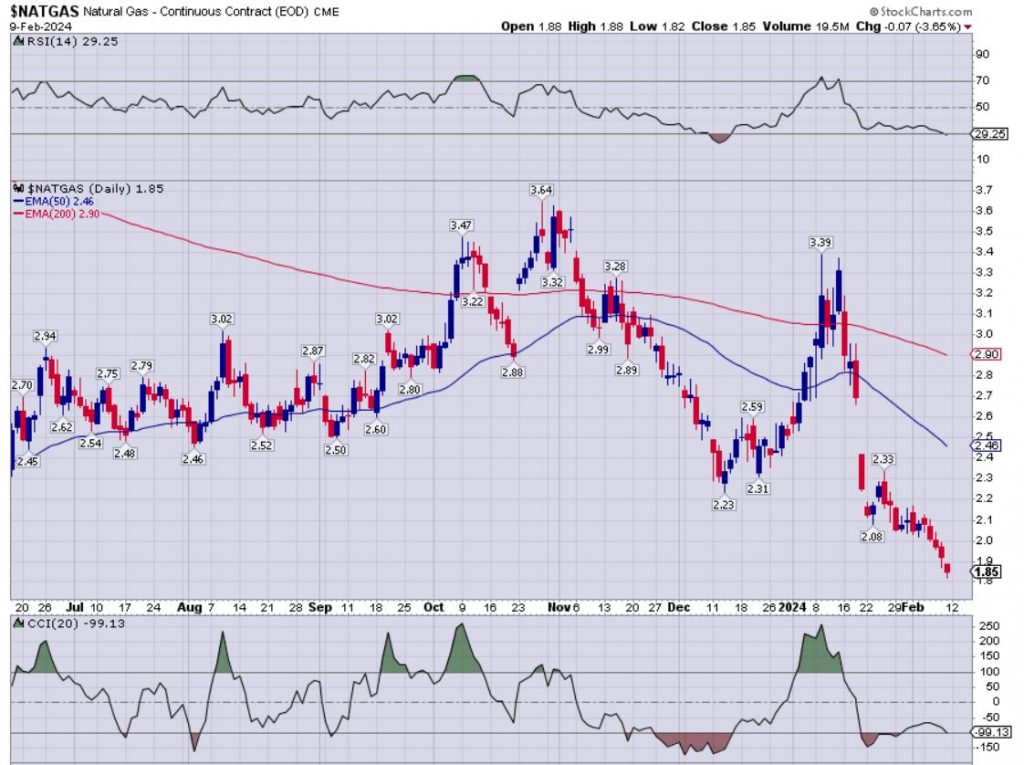
Zooming in on the daily futures chart for natural gas, one can see that large gap lower that occurred in January from the $2.70 area down to $2.40 suddenly, which then kicked off a cascading waterfall decline down into the low $2 and now the $1.80s. How low will the widow maker go? It’s hard to know, and many contrarians have been trying to “catch the falling knife” for the last few months only to get further cut. It is reasonable to think that when the pricing does finally bottom and base, that the gap zone between $2.40-$2.70 would be the first key resistance area. Maybe this will occur as the liquid natural gas (LNG) terminals in Canada come online to start exporting some of that nat gas to Asia.
Now Let’s Turn Our Gaze To The Oil & Gas Stocks:
The best ETF proxy for the oil & gas major producers is still the Energy Select Sector SPDR Fund (XLE). Looking back a few year to the pandemic bottom for all sectors in 2020, it is interesting to note that it not only rallied later that year, but also all through 2021, and into mid-2022. It is important to point this out, because often we here that energy stocks only went up due to the conflict in Ukraine with Russia, but this trend higher in oil, nat gas, and the related stocks started 2 years before that and had made most of that move before any of that geopolitical issue even surfaced in Feb/Mar of 2022.
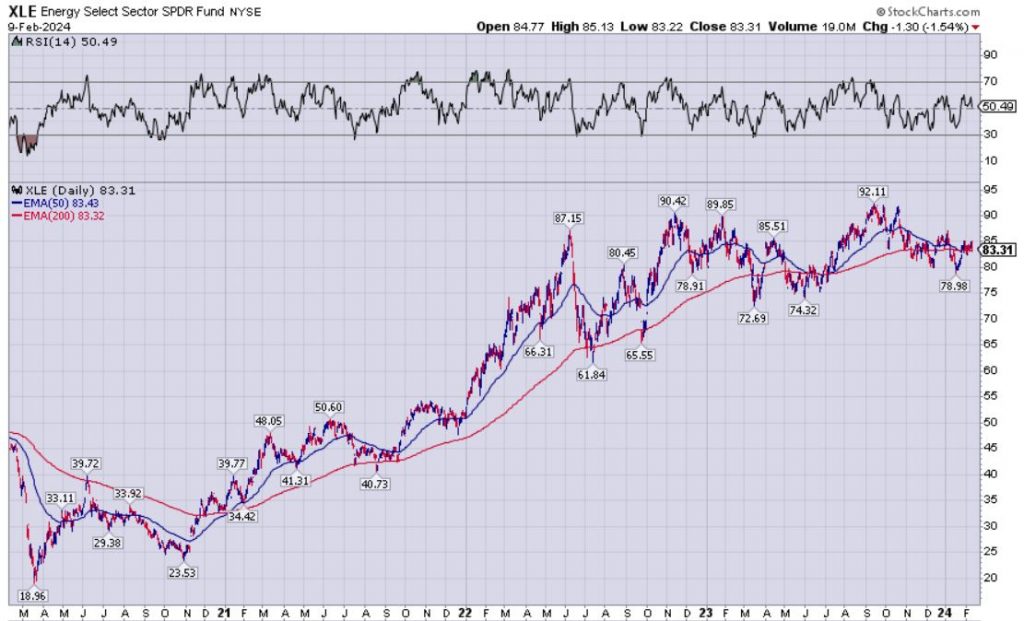
It’s also important to note that since mid-2022, after the peak and then sharp reversal down during those summer months (June-August), that the price action in (XLE) has mostly channeled sideways through present in a range of the low $70s to low $90s. Once again, a boring overall market for longer-term “buy and hold” investors, but a great setup for more active traders playing both sides of that pricing range. Additionally, it should be noted that the larger oil producers pay some of the nicer dividends compared to almost any other sector, and so it has been unique in that longer-term investors have been paid to wait for each month/quarter or through special dividends due to robust free cash flows.
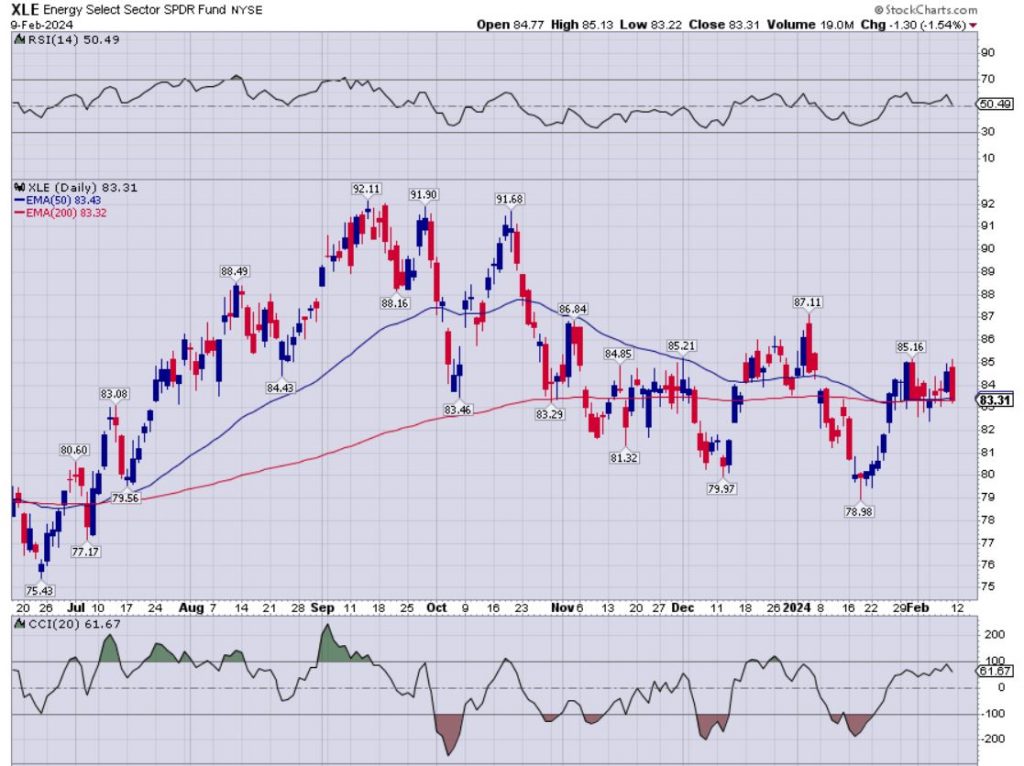
Zooming in on the 1-year daily chart of XLE below, one can see where the pricing close to end last week at $83.31 was right where the 50-day EMA at $83.43 and the 200-day EMA at $83.32 have all converged. This is very boring overall average price set up, smoothing out the price swing volatility noise. Now sometimes this kind of pricing compression and convergence can be a harbinger of big break either direction, but sometimes it can just indicate a more prolonged sideways pricing channel. The RSI strength indicator above the chart is reading a 50.49 the end of last week, and the CCI strength indicator below the chart is reading 61.67, so both of those are also in neutral territory.
If I was to hazard a guess at the direction moving forward, then it would appear that the bears are still in control in the near-term, looking at the pattern of lower highs and lower lows since that brief move up into the low $90s last Sept/Oct. Until that pattern changes, then it is likely that we’ll see the XLE go back down and test the high $70’s once again, and breaking below the prior troughs at $79.97 and $78.98 would only strengthen the bearish case. Energy stock bulls will want to see the pattern change to breaking above prior peaks at $85.16, $87.11 from earlier in January, and lateral price support at $88.49 from last August, to get back in a more bullish posture.
For those wanting exposure to the smaller and mid-tier oil & gas producing and development-stage companies, that are not as solid as the big boys, but also present more of a growth wedge, then the SPDR S&P Oil and Gas Exploration and Production ETF (XOP) is a good way to track that segment of the energy stocks. Like most junior sector resource stocks, these tend to outperform to both the upside and downside, as evidenced by them making over 6-bagger gains from the 2020 low at $26.67 to the 2022 peak at $162.48. During that same time period in the big energy sector surge the (XLE) only made 4.6-bagger gains.
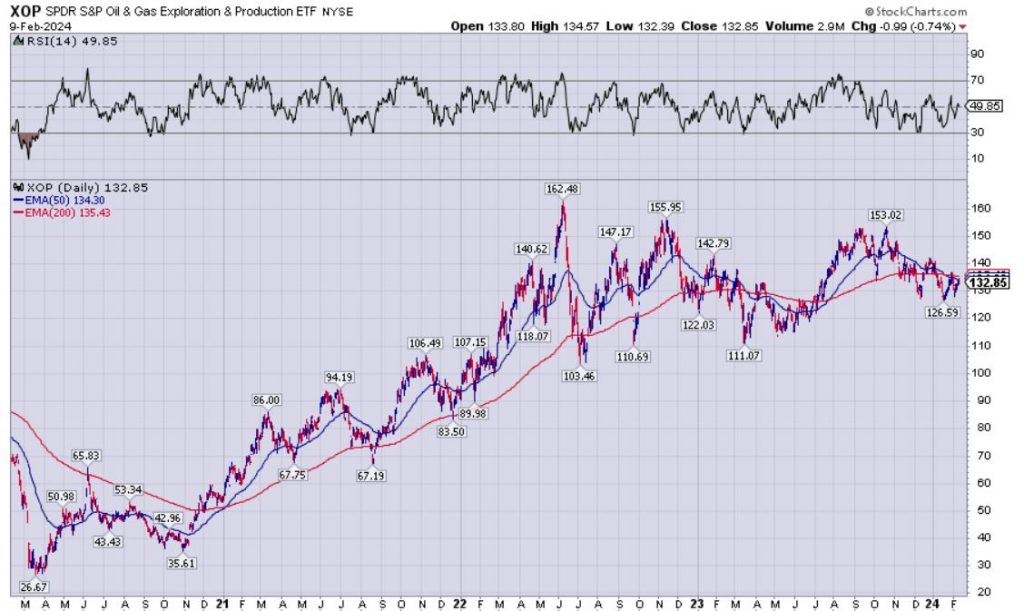
Now looking at the recent past, this echoes all the comments made above about the larger producers in the XLE, in that these smaller stocks in the XOP have basically been stuck in a sideways pricing channel since the extreme volatility of the peak and then sharp correction in the summer of 2022 was followed by more of a consolidation and whipsaw markets. It’s the same takeaway in that it has been boring for longer-term value investors, but presented lots of opportunities for shorter-duration swing-traders and position-traders.
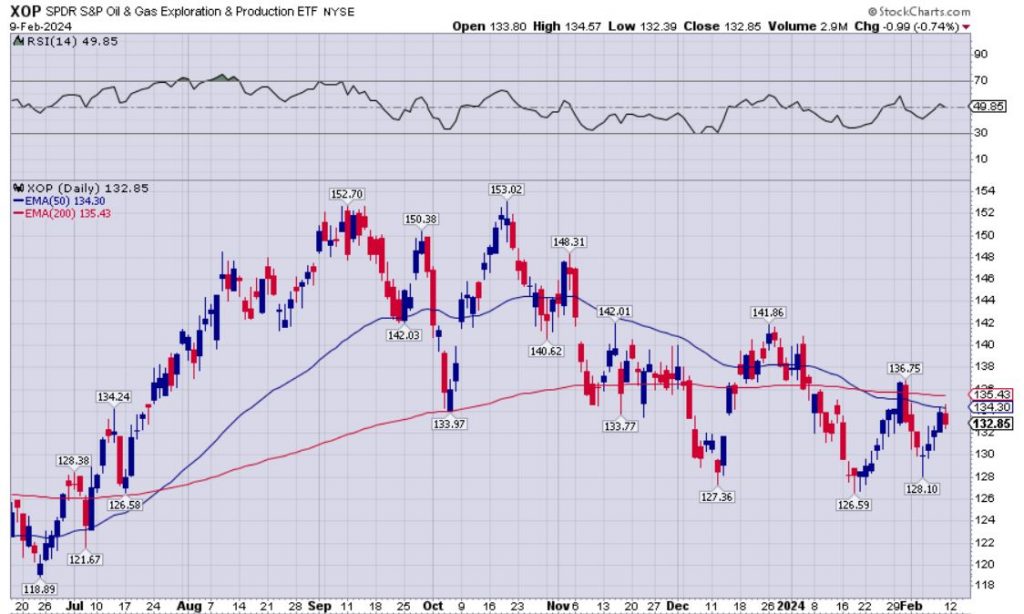
Recent price action for the XOP, like the XLE has once again converged into a tight area with last week’s close at $132.85 being near, albeit below, the 50-day EMA at $134.30 and the 200-day EMA at $135.43. That in itself is slightly in the bearish tilt, and with the pattern of lower highs and some new lower lows in January of this year, the bias is still to the downside. What is a bit more encouraging is that the January lower low of $126.59, preceding the December low of $127.36, was followed up earlier this month with a higher low of $128.10. It’s way too early to know yet, but if that could mark the beginning of a new uptrend, then we’d want to see prior peaks at $136.75, and $141.86 eclipsed and closed above on daily, and preferably weekly basis. For now the bulls have a lot of work to do, but it is something that we’ll keep monitoring.
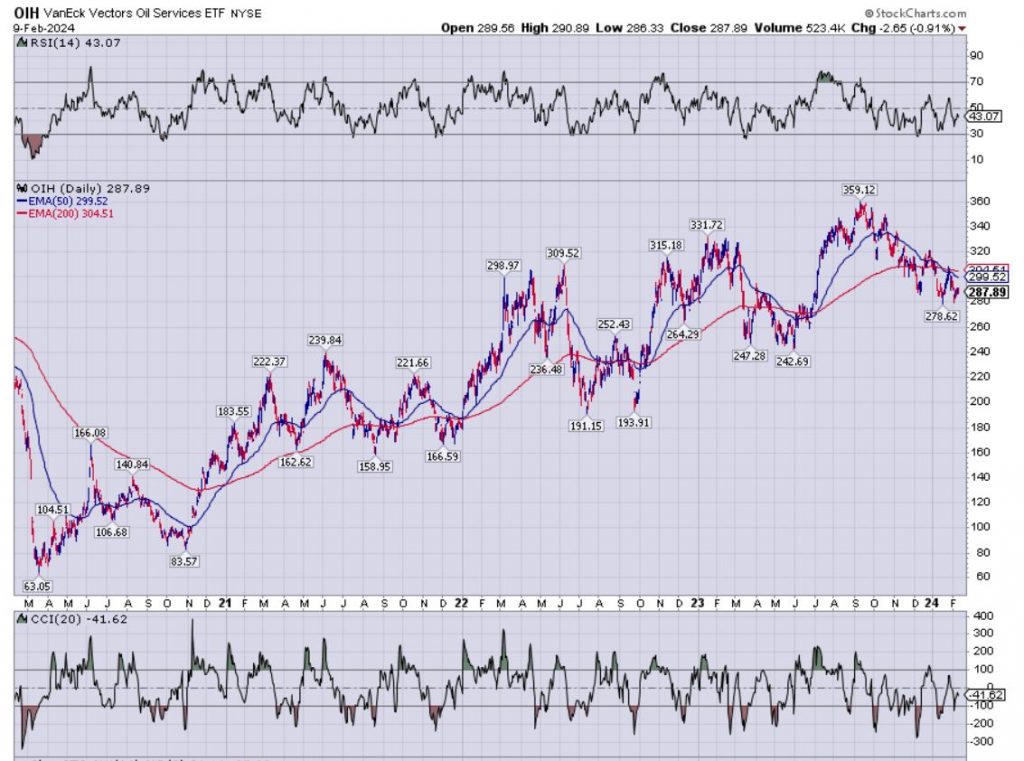
For some oil & gas investors, they like to play the sector using the “oil services” stocks which can range from drillers, to pipeline companies, and other equipment or tech support companies. (i.e.. The picks and shovels side of the business). The best vehicle to track this with is the VanEck Vectors Oil Services ETF (OIH). What we can say is different about this longer-term chart over the last few years is that since it’s 2020 pandemic crash low, it has maintained a more steady uptrend through present. In contrast to XLE and XOP that peaked in 2022, the peak for OIH was actually just last autumn in 2023 at $359.12, and while has pulled back down since then, it has beautiful chart pattern of both higher lows and higher highs for the last 4 years.
This is a much more bullish chart overall when looking at it bigger picture, but it should be noted that pricing closed last week below both the 50-day and 200-day EMAs, and in the recent past it does have a pattern of lower highs and lower lows, for a more short-term bearish trend to the downside over the last 6 months. We’d need to see the lows from last summer at $247.28 and $242.69 pierced on the downside to get longer-term bearish, and for now, the question is if we are going to see support down in the high $270s hold for the next move higher, or if it going to stay under pressure with the rest of the oil & gas stocks.
Let’s Wrap Up Taking A Look At “White Oil” – The Lithium Sector:
What we can say about Lithium is that it was a long-time coming to see the rally we inevitably did experience in both Li pricing and also the huge surge in related lithium stocks a few years back. I was personally very table-pounding bullish on accumulating the best-in-breed lithium juniors back in 2017-2020, and wrote about it quite often at both the KE Report and Ceo.ca. Of course, it was then quite thrilling to see the investing thesis finally bear fruit in a meaningful way in the huge surge during the post-pandemic crash through the end of 2021. At that point, I personally liquidated all my lithium stock positions in late October of 2021, and the overall rally finished peaking a month later in November of 2021.
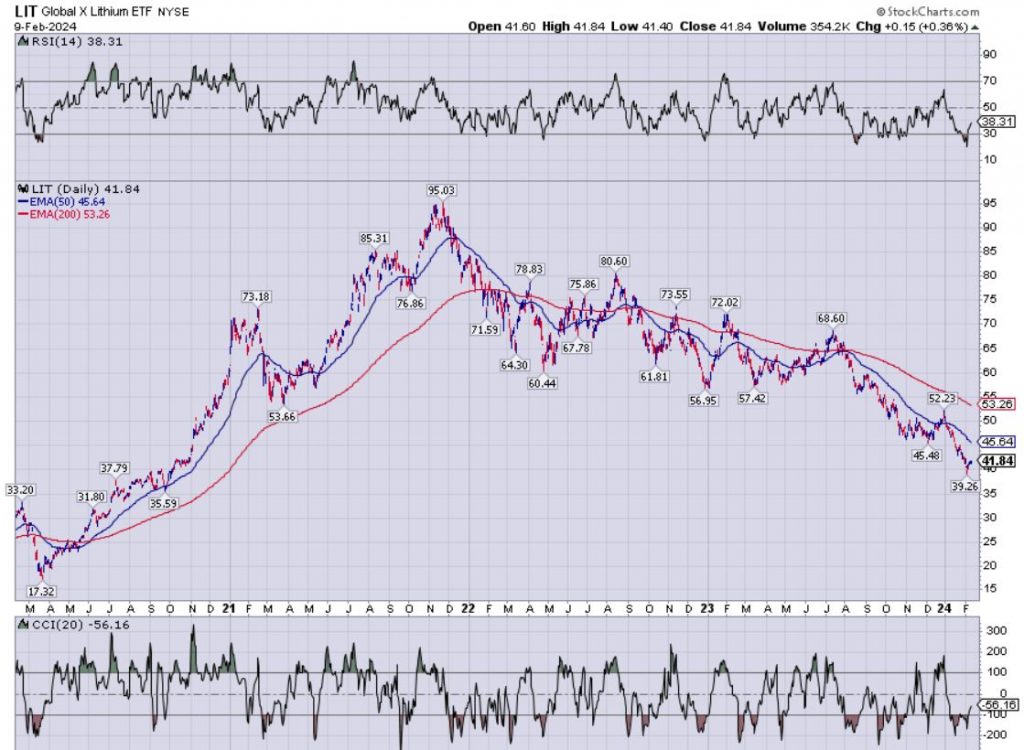
Since then, the overall lithium stock sector, as it relates to the big producers and key players in space, has been decisively in a decline through present time as Li prices came back down to earth, and China’s economy slowed. It is starting to look somewhat oversold here and could be due for relief rally in the not-so-distant future.
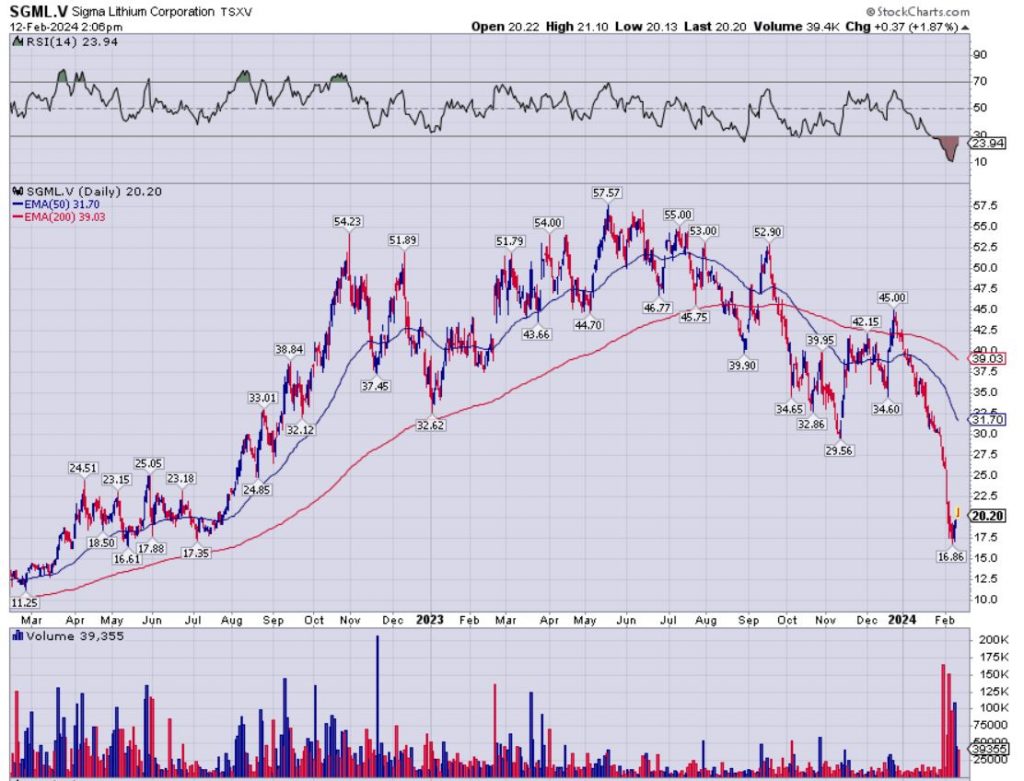
Additionally, (Yes) I’m very aware that in 2022 and early 2023 there was a whole last wave of lithium juniors claiming they’d be part of imminent wave of Direct Lithium Extraction (DLE) producers, spearheaded by Sigma Lithium (SGML.V). DLE has been “just a few years away” for the last dozen years, and to date most companies have not gotten past pilot-plants and promises, nor have any companies achieved commercial scale production. There are no shortage of prognostications from company executives or lithium investors though claiming “it’s coming”… [at one nebulous point in the future].
- An interesting update with DLE is that Exxon Mobil (XOM) is presently getting very much into this space at present (right near where Sigma Lithium has been developing their resources); and they’ve announced plans to supply over a million EV batteries worth of lithium by 2027. If that is true with regards to energy giant Exxon Mobil, then Chevron and BP and other oil & gas peers won’t be far behind in flooding the markets with more lithium in the next few years. If one plays this out in their minds eye, that would likely wipe out most competition due to the size and capital those companies could throw behind DLE.
Additionally and in parallel in 2022 & 2023 there was the whole wild lithium exploration frenzy in the James Bay area of Quebec, spearheaded by the epic rise and then fall of the Patriot Battery Metals (PMET.TO) stock price, and related near-ology exploration plays. No doubt about it, the grades that PMET were hitting were phenomenal, and they did an excellent job putting out a ton of drilling information, and likely have a viable project there could be a mine someday. But it was the stampede into it by investors that pushed the stock up to nosebleed valuations that really kicked off a full on area-play rush to stake adjacent land claims and a bunch of newly minted Li companies.
However, in response to their success; suddenly, {almost overnight}, the retail hordes had finally discovered pegmatite and that spodumene had lithium (something that had been discussed for a long time in the space and in other companies like NeoMetal/Minerals Resources, Galaxy Resources, and Pilbara Minerals had already demonstrated this for years from exploration, to development, and then actually into production). It didn’t matter though, because the #UsToo game was on… and rocketship to the moon emojis were circulating in full force. Until they weren’t…
Well, at least for a while there sure was a lot of excitement in that very narrow search for more hard-rock exploration projects nearby PMET or any project anywhere that could drop pegmatite in a press release (not concerned with whether there was economic grades of lithium). Some companies (which I’ll not name) just shot higher based on staking some land, and rebranding their corporate presentations with a few slides with pictures of EVs on them. Not surprisingly, stocks in that James Bay jurisdiction and even companies in completely unrelated other jurisdictions, that traditionally were focused on other commodities, suddenly found they had these same pegmatite geology on their land. Of course the junior mining sector penny dreadfuls never miss an opportunity to rebrand and to market a hot story to investors accordingly. Since then the lithium prices have collapsed, along with investor sentiment, and most company share prices.
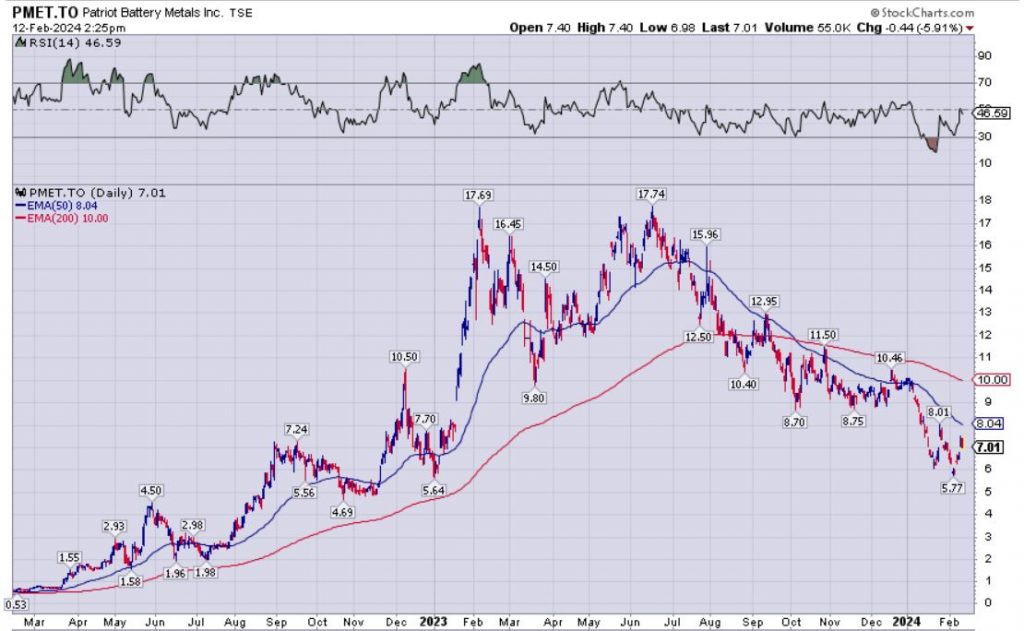
To be crystal clear here, that doesn’t mean that there aren’t still opportunities in the lithium stocks, or that some of the main projects that started the rush into lithium DLE and/or the pegmatite-focused exploration stocks that just surfaced over the last few years don’t have merit. There are a few legitimate newer companies like Sigma Lithium and Patriot Battery Metals, that did lead the last charge, and may still be viable, especially now that their valuations found gravity and retuned back to Earth.
The point is simply that most of the #UsToo companies are not going to be economically viable if prices stay depressed, and likely weren’t going to work longer-term even if prices had stayed elevated. When one considers all the other competition entering the scene, not just from more brine production in South America, but especially if the big boy oil & gas companies like Exxon really do turn on the DLE switch and start producing high-quality lithium at very low costs in the next few years. It had become a crowded trade, and that is fun until it runs it’s course… and then it becomes a rush to the exit doors trade.
That is actually a good place to wrap it up here, illustrating an important point for resource stock speculators. As investors in the highly cyclical commodity space, we want to be getting into our positions early on in niche markets (like Palladium, then Cobalt, then Lithium, and most recently in Uranium) with the best of breed companies. Personally, my preference is to position into the better companies, that have been focused on a given sector for years, with a specialized team that really understands a given commodity, and with a legitimate pathway to production.
- The key takeaway is to seek out emerging megatrends that are still early on in their growth cycle, before it gets too much traction and upside momentum going. Once the mega-trend becomes too obvious to the masses and valuations become mega-sized, then scrambling to jump into nearby close-ology plays that have not proven they even have ounces or pounds in the ground yet, is typically a late-stage phenomenon riddled with eventual bagholders. So if you are reading this and missed the big runs in Palladium, Cobalt, Lithium, or Uranium…. then the good news is that there are still plenty of commodities with interesting fundamental setups over the next few years that are out of favor at present.
Hello copper, nickel, silver and gold equities… heck, we may even consider nat gas stocks.
Thanks for reading and stay tuned for Part 8D out later this week on my Substack channel:
https://excelsiorprosperity.substack.com/
…and, of course, it will also be posted exclusively here on the KE Report.
Ever Upward!
– Shad
Peak Oil is Closer Than You Think
Goehring & Rozencwajg – 02/09/2024
“Adam Rozencwajg, CFA, Managing Partner at Goehring & Rozencwajg (G&R), joined ‘Off the Cuff’ Podcast with host Chris Martenson of Peak Prosperity to explore the most vital but overlooked topic of our times: Peak Oil Is Closer Than You Think.”
“With our models and analyses, G&R projects that the one final and last mega oil basin in the US – the Permian – is set to hit peak output in 2025. And if it does, it could set off alarm bells within the US and across the world, resulting in vastly higher oil prices. So, why do we think it is close to peak? What about the Marcellus – the monster US natural gas shale field?”
Just a note and observation., no argument here.. 🙂
“So you are reading this and missed the big runs in Palladium”, ????? …. Your comment Ex…
Platinum…over took palladium last week… changing of the guard… 🙂
Last week at the coin dealer…. platinum was $125 over spot… on coins…
where gold and silver were soft on the premiums…
Today … spot higher … go to the 2 min mark………… for comments on platinum premiums…..over spot…$170…. scarce…. 🙂
Coin collectors special report,,,, from THE OWL COINLAND REPORT…special agent on the ground… 🙂
Hi there OOTB. Yes, indeed it may be Platinum’s time to shine.
My comment about Palladium, in the article, was referencing that big run a few years back to $2400 or so and we saw many of the PGM mining stocks up 300%-500% on that move. Clearly it has pulled back down since then, but it was an epic move from 2021 into 2022.
Hi Ex, Bob M says that we will soon start to see more inflation going forward due to The Houthis raising the cost of shipping in The Red Sea. That will mean higher rates not lower. I tend to agree! I believe he mentioned prices of shipped goods costing 10 to15% more. DT
Thanks EX for the reply…..
Platinum NOW ahead of Palladium …… $25…… been several years since this has happened….
So, what does that mean…. hummm……… autos are going down the tubes… 🙂
Yes, it has been a while since we’ve seen platinum with the premium to palladium. Nice!
The Great Salt Lake Is Full of Lithium. A Startup Wants to Harvest It.
Lilac has raised $145 million from Bill Gates’s Breakthrough Energy Ventures, other investors.
By Scott Patterson – The Wall Street Journal – Feb. 12, 2024
“America’s biggest saltwater lake may hold a key to the country’s energy future. This summer, a California startup plans to start construction on a project to suck up water from the Great Salt Lake to extract one of its many valuable minerals: lithium, a critical ingredient in the rechargeable batteries used in electric vehicles.”
“At its peak, Lilac says it will use a series of pipes to suck up 80,000 gallons of water a minute to harvest the mineral. The company plans to eventually produce up to 20,000 tons of battery-grade lithium a year at its site in northern Utah, located among fields of cattle and pickleweed.”
https://www.wsj.com/science/environment/great-salt-lake-lithium-startup-lilac-d84c9f76