
Week In Review And The Week Ahead – Part 9 – Gold, Silver, Copper, Uranium, Oil

Excelsior Prosperity w/ Shad Marquitz (04/02/2024) – Substack Article:
https://excelsiorprosperity.substack.com/p/week-in-review-and-the-week-ahead
In the investing world, sometimes the winds of change can come quite quickly, either from various macroeconomic currents acting on the markets in force, or the micro-fundamental factors shifting for a sector or an individual company.

In the investing world, sometimes the winds of change can come quite quickly, either from various macroeconomic currents acting on the markets in force, or the micro-fundamental factors shifting for a sector or an individual company.
As a result of these winds of change, I started writing and then rewriting this Part 9 in the “Week In Review and Week Ahead” series over and over again for the last 6 weeks. I’ve had a morphing and continually reshuffling document pulled up on my computer with tons of different economic data outlined: focusing on Fed rate cut expectations, inflation data, jobs report data, manufacturing data, housing data, commercial real estate, regional banks, consumer confidence and spending reports, and developments from central banks and economic news over in Europe, Japan, China, and India…. However, each week I’d purge the prior stale-dated economic news, to update it (again) with even more incoming macro information. This amounted to abandoning the Part 9 “week in review” article each time, in lieu of other pressing news in the commodities sector and the resource stocks.
So… as I started this Part 9 article again, I looked at the dozen or so pages of macroeconomic data that I’d been compiling and decided to just delete it all! (preferring instead a complete page 1 rewrite and new direction for these weekly updates moving forward).
- There is just so much macroeconomic noise out there for investors to sift through, and such a huge volume of constantly changing information to stay abreast of. The reality is that there are already so many other sharp thought leaders out there, already doing a bang-up job of canvasing those larger economic data points. My investing strength is really in analyzing the commodities sector and related stocks.
- So, moving forward, I’m going to periodically do more of these “Week In Review and Week Ahead” articles whenever the notion arises, (but they may not actually be every week), and they will likely be an eclectic assemblage of what’s on my radar screen at that moment in time in the commodities sector. I may still weave in some of the macroeconomic news when appropriate, but feel it is more germane for readers here to keep these mostly focused on the resource investing universe.
- We will also continue focusing on specific commodities sectors or stocks during mid-week articles. Additionally, there will be even more multi-part series starting up on different commodities or also different stages of companies within a given sector (producers, developers, explorers, royalty companies), so stay tuned…
>> So with that housekeeping out of the way, let’s dive back into resource sector investing.
____________________________________________________________________________________________________
Gold Just Had A Superfecta close on March 28th, and it continued higher to kick of this week.
Our buddy Craig Hemke, founder of the TF Metals Report, pointed out to us, (over at the KE Report last week), that a “superfecta” is a betting term referring to 4 correct picks on the same bet. So with gold setting an all-time record close on the daily chart, weekly chart, monthly chart, and the quarterly chart on the last trading day of March (at $2,238.40), it was one of those rare moments. I’d like to share that interview we did with Craig here, because it perfectly marked the occasion.
Craig Hemke – Gold’s Superfecta! Daily, Weekly, Monthly and Quarterly All Time Highs
March 28, 2024
The longer-term monthly and quarterly charts are key for institutional funds and some of the algorithms for machine trading. Gold putting new all-time highs on both the monthly and quarterly charts in March, stacks up to a continuing bullish longer-term breakout from a technical basis that shows some real conviction. More active swing-traders prefer using the hourly or daily charts, and there were plenty of fireworks there for sure the end week on Thursday (markets were closed on Good Friday). For this article I’m going to highlight the weekly gold chart, because it is really the best tool for position-traders, looking to trade their market positions over several months to a year.
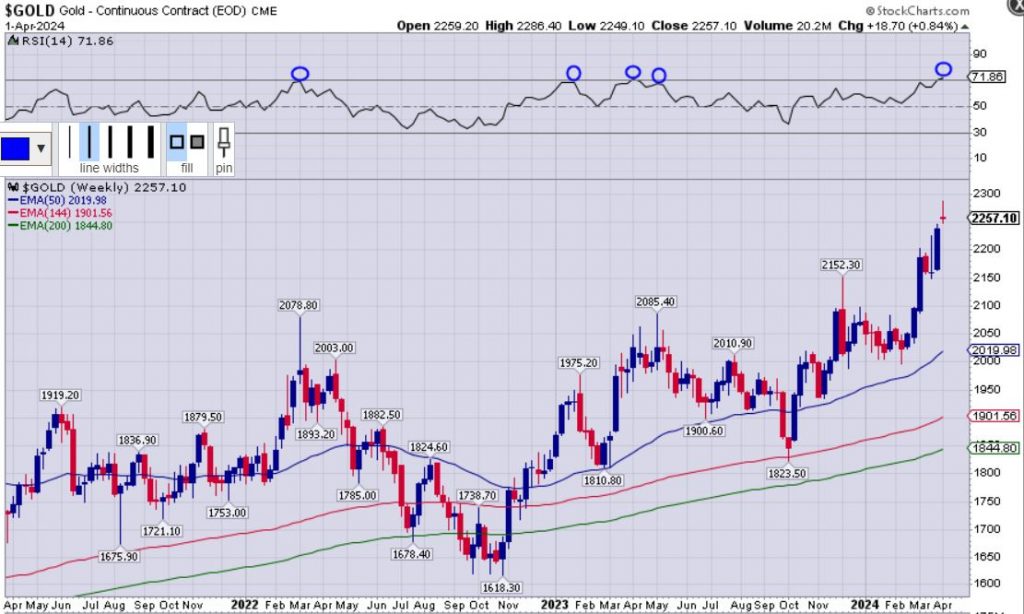
It is clear to see on this chart that gold has been making a pattern of higher highs, climaxing just yesterday with a close at $2.257.10 (and making an intraday high of $2287). Also as previously mentioned, that significant weekly close at $2,238.40 to end March and Q1 2024 was very significant on the major charts, further confirming this breakout move. Again, this is an incredibly bullish looking chart, and pricing is solidly above the 50-week, 144-week, and 200-week Exponential Moving Averages (EMA); which are all sloping up higher. No doubt that this has absolutely been a bullish blast higher; but as a word of caution, the price is now pretty stretched above the 50-week EMA, to the point where it would not surprise me to see some short-term backing and filling in a consolidation move in the weeks to come. That would be healthy and normal.
Another thing I wanted to highlight on this chart is where the Relative Strength Index (RSI) reading is for gold on this weekly chart, currently at 71.86. RSI is one of the momentum indicators that many technical analysts utilize, which measures the speed and magnitude of an equity’s recent price changes to evaluate potentially overbought or oversold conditions. Normally a reading below 30 is considered oversold, and a reading above 70 is considered overbought, but there are many charts where a stock or ETF or commodity can stay oversold or overbought for a long time or go to extreme readings in the high 80s or 90s, before turning the other direction.
As a result, it is best to look at how an individual stock is acting over time in relation to any chart indicator, to get a sense of their unique correlation. With gold in specific, it has a tendency to put in an intermediate top on the weekly chart as it approaches the RSI of 70. I just wanted to point out where the prior peaks were in relation to RSI on the chart above (highlighted with the blue ellipses). Gold has not really blasted up above 70 the last few years, at its pricing peaks; however, this move has so much more momentum, that maybe it will this time.
- Now what about the gold stocks?
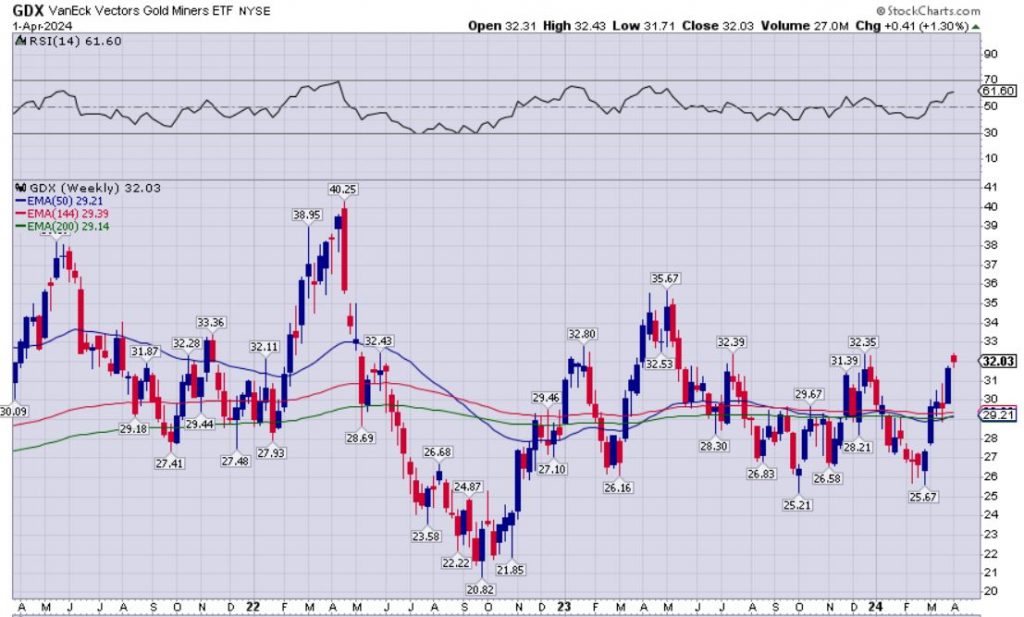
Well, looking at GDX, the VanEck Gold Miners ETF, we can see on it’s weekly chart that nice bullish candle from last week, closing at $31.62, and higher close to kick off Monday of this week at $32.03. These closes were both well above the 50-week, 144-week, and 200-week EMAs which is bullish action. It’s RSI is currently at 61.60, so still not really in overbought territory, and that gives the gold mining stocks more runway to keep climbing higher.
Still, many have publicly noted that this gold stocks chart is not nearly as bullish or breaking out to new highs, like the gold price chart is. This is because gold and gold equities are 2 different asset classes and have different dynamics, different types of investors, and different momentum trends on the charts. A global commodity and “un-currency’ like gold, is considerably different asset to chart, compared to a basket fund of 60 individual gold mining companies, that each have their own unique micro fundamentals. Comparing the charts of gold and GDX expecting them to completely correlate is fool’s errand, and is an “apples and oranges” situation… yes they are both sweet fruits, but the mining stocks can be a bit tart at times.
- On Thursday’s historic superfecta closing day in gold, we also had a very engaging and nuanced discussion on the precious metals sector, with our pal Robert Sinn (aka Goldfinger and CeoTechnician). We got into this very point about gold and gold stocks being different asset classes, and got his technical outlook on their related charts, as well as silver.
Robert Sinn – As Gold Prices Head Towards Nirvana, Gold Stocks and Silver Still Have Work To Do
– March 28, 2024
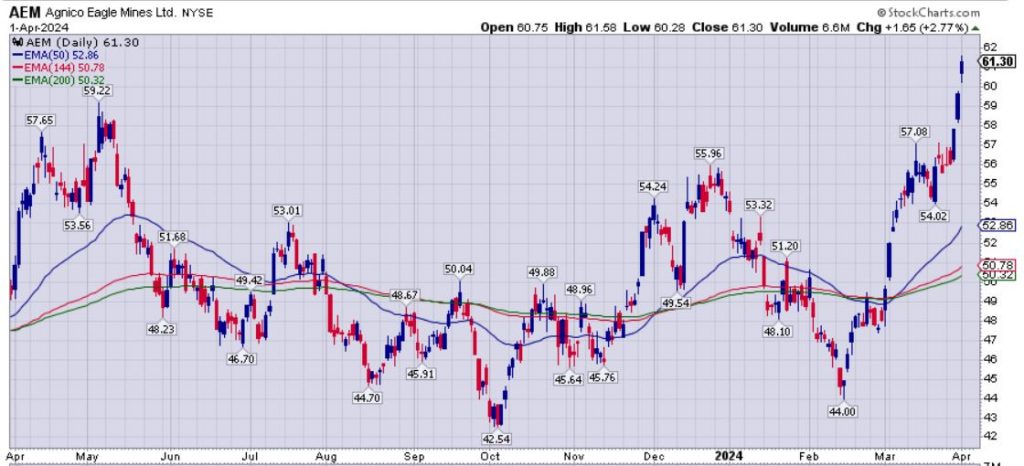
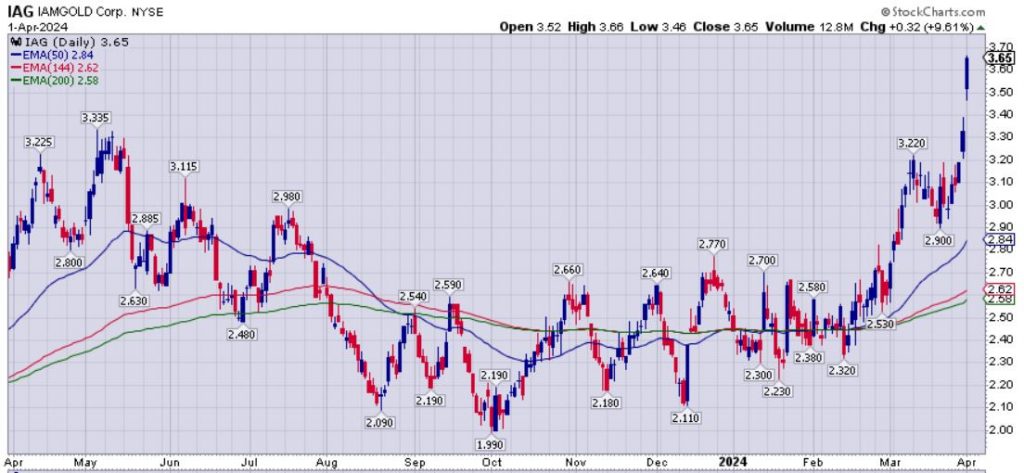
In the interview linked above, Robert makes the point that despite GDX having a more muted breakout in price recently, there are many individual gold stocks popping higher, and some larger stocks like Agnico Eagle (AEM) and IAMGOLD (IAG) even making 52-week highs this last week. Those kinds of moves will be important as they start showing up on many technical stock screening programs for generalists, and those traders will note more gold stocks showing relative strength.
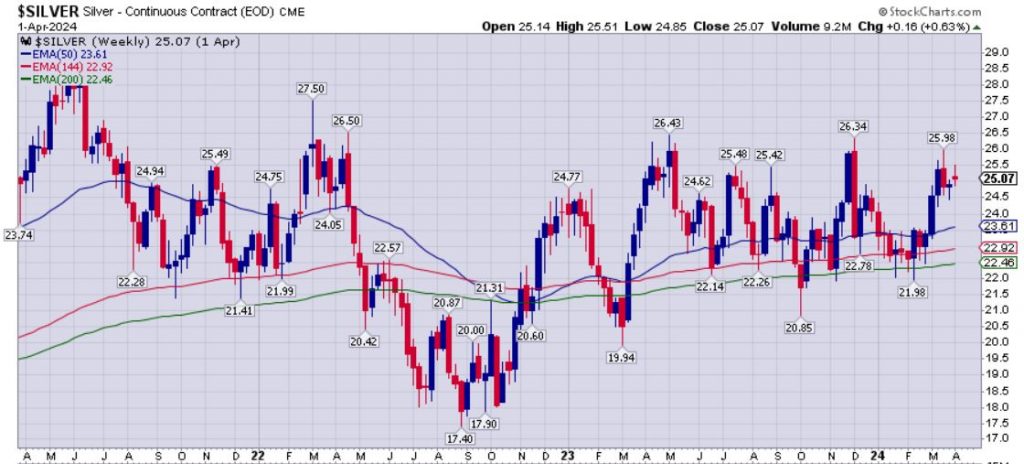
How About Silver And The Silver Stocks?
Silver is still in a somewhat bullish position, having closed the week at $24.92, and Monday of this week at $25.07; both decisively above the 50-week, 144-week, and 200-week EMAs. However, overall has been in a sideways pricing channel from around $22 – $26.50, and thus still boring investors to tears. Silver bulls will want to see it put in some weekly closes above that range of prior peaks ($26.34, $26.43, $26.50); so a close definitively above $26.50 will get the animal spirits going in the lessor precious metal once again.
As far as the silver stocks, I prefer looking at (SILJ), the Amplify Junior Silver Miners ETF, as it is the most speculative of the main precious metals ETFs. SILJ is still crammed full of a lot of senior silver/gold producers as well as smaller junior producers, in addition to the larger silver developers and then further down the list of holdings a few of the more advanced explorers; so it is a good overall proxy for the more speculative side of the precious metals sector.
SILJ closed last week at $9.93, and Monday’s trading session at $10.31, which is above the 50-week EMA (currently at $9.47), but still below both the 144-week EMA (currently at $10.43), and the 200-week EMA (currently at $10.69). The junior silver mining stocks still have more work to do to really blast out above those moving averages, which are currently the next overhead resistance levels. It will be interesting to see how this week plays out and if they have the juice to really break out.
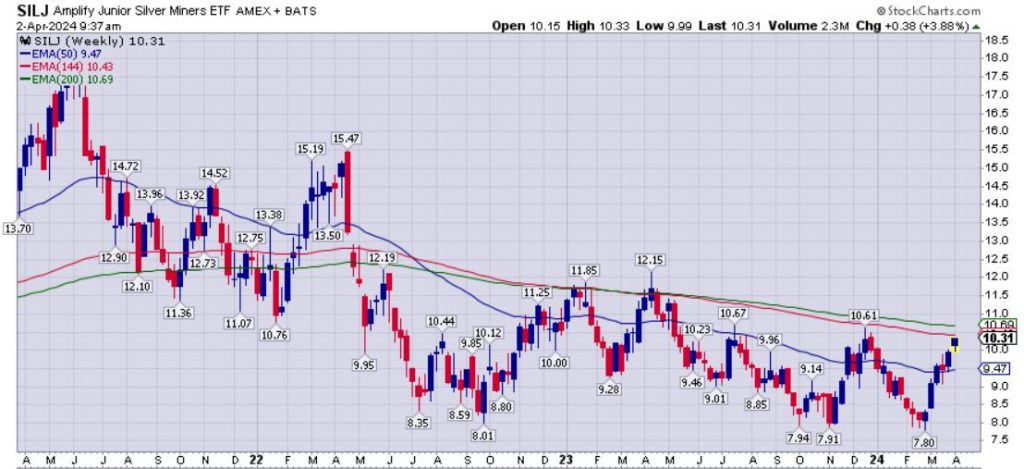
It is also quite telling that that longer-duration 144-week and 200-week EMAs are at higher prices than the shorter-duration 50-week EMA, and that they are still sloping downward. This really highlights the overall bearish price action we’ve seen the last couple years. Silver mining stock bulls will want to see SILJ break above $10.70 first (which would eclipse both longer duration EMAs and the recent peaks at $10.61 and $10.67), but ultimately it needs to clear that prior peak from last April at $12.15 to really bring in more momentum traders.
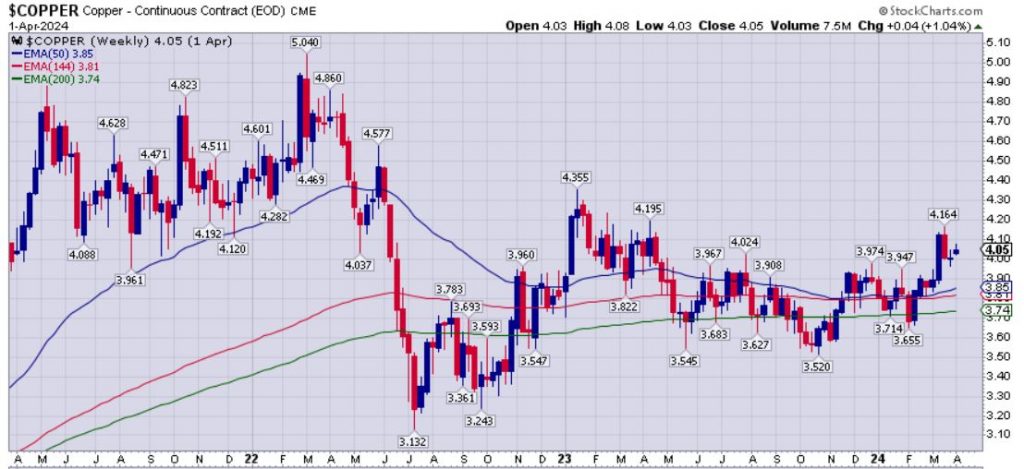
What About Doctor Copper?
With regards to the good doctor, not much has really changed since last week, where I wrote a whole piece about the recent pop higher in copper and the copper stocks. For those that missed that article, it has much more detail on the daily charts of copper, COPX, and COPJ, than I can provide in this update.
- Did Doctor Copper Just Put On His Dancing Shoes? – March 25th, 2024
https://excelsiorprosperity.substack.com/p/did-doctor-copper-just-put-on-his
I will include this Copper weekly chart here though, since that article was more focused on the short-term trends on the daily charts. Copper closed last week at $4.01, and the first day of this week at $4.05, both bullishly above the 50-week, 144-week, and 200-week EMAs. However, there are still a lot of resistance levels to clear in the mid $4’s, to make any attempt to break the all-time high from early 2022 at $5.04. A break above last year’s peak at $4.355 would bring in more momentum traders, to get things moving, and then there is a lot of resistance in that $4.51-$4.62 congestion zone that will likely take a while to chew through on the next attempt higher.
Let’s Check In On The U-Stocks:
The Uranium spot price has pulled back from the lofty levels it started the year at from January to early February, but did see prices bottom in March and then start trending a little higher the last 2 weeks. As a result, the uranium stocks sold off in sympathy in February and early March, but have started to rebound again the last couple of weeks.
Let’s review the chart of (URNM), the Sprott Funds Uranium Mining ETF.
You can see that the 50-day EMA has remained a magnet for pricing, (having shifted from support to resistance, and hopefully now back to support again). Also, the 144-day Fibonacci EMA did offer some recent support, and marked where pricing reversed on a number of the U-stocks. I don’t have the space in this update to post a lot of the individual uranium stock charts, but suffice to say that they have very similar looks, with regards to pricing bouncing of the 144-day EMA support, and holding around the 50-day EMA area, and then just recently breaking back higher again.
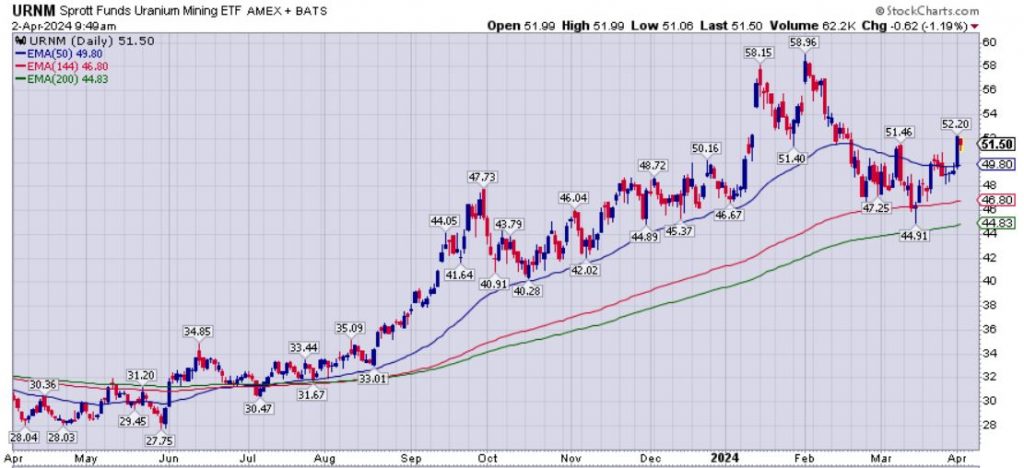
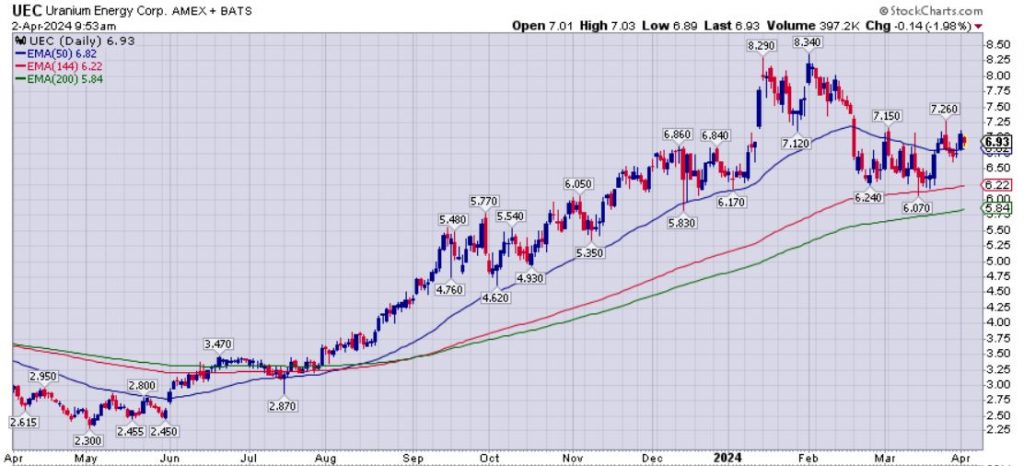
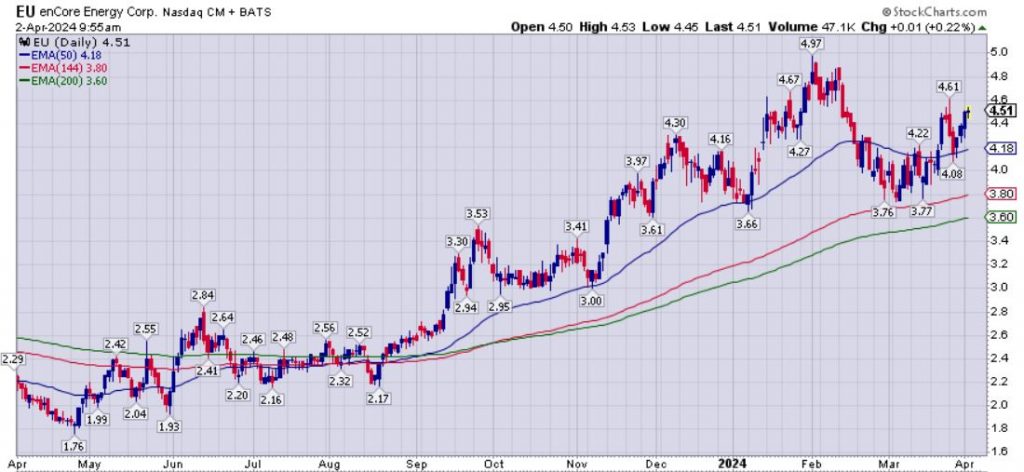
It is encouraging to have seen the uranium price and the related U-stocks bounce the last couple of weeks, but then again, a bounce was really overdue after the selling pressure for the prior 6 weeks leading up to that. Investors will want to watch to see if the uranium stocks can remain above the 50-day EMA and start using it as support again, instead of resistance. We are seeing a few examples of uranium stocks like Uranium Energy Corp (UEC) and enCore Energy (EU) doing just that.
If the uranium stocks do go back into a corrective move, we’ll look back to the 144-day EMA as first support again. However, as mentioned last month, the 200-day EMA is still the major support underneath that level, should the selling pressure persist in this sector.
Oil is doing much better again, but the larger oil stocks are really breaking out:
Overall, the oil price has been more rangebound for some time, but over the last few weeks has broken above $80 closing last week around $83, and popping up to $85 early this week; so it is finally doing better and in a more bullish posture.
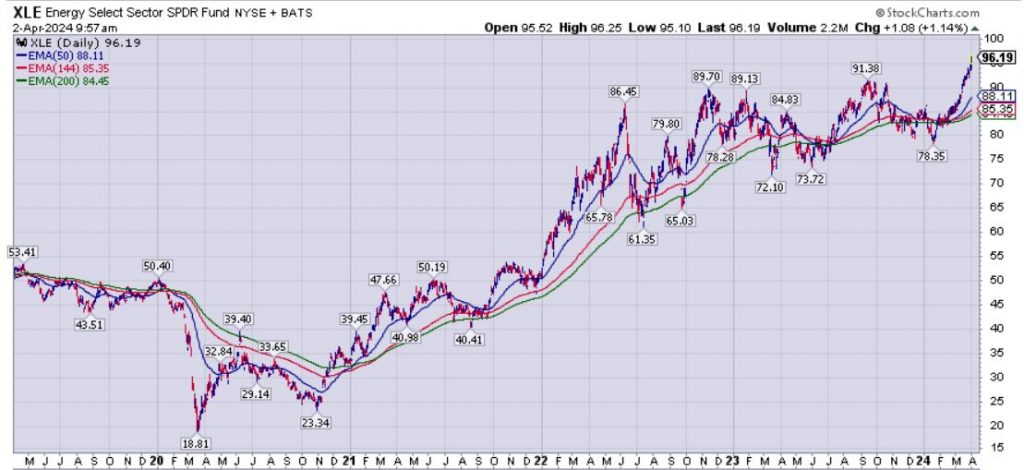
However, what has been a real eye-opening has been the larger oil stocks in the (XLE) Energy Select Sector SPDR ETF breaking out to new 52-week high at $94.41 to end last Thursday, last week, last month and last quarter. Like the breakout in gold, this was a superfecta for this key oil producers SPDR ETF. Wow!
- XLE continued cruising higher the first trading session of this week, closing Monday at $96.19.
I’ll have more thoughts on the oil, nat gas (which looks to have bottomed and is ratcheting higher), and related energy stocks in the future. Additionally, I may dive into some quality mid-tier and junior energy companies in my portfolio and on my watchlist. For now, it just needs to be stated that the larger oil stocks have been doing fantastic on the back of this recent pop above $80 in the WTI oil price, and they are starting to offer solid leverage to the underlying commodity once again.
Thanks for reading and may you have prosperity in your trading and in life!
-
Shad
What a Herculean breakthrough resource here, Shad, for all resource investors! Thanks very much!