
Gold, Silver, Copper, Nickel – Week In Review Part 8D

Excelsior Prosperity w/ Shad Marquitz – 02/18/2024
Hi folks – Let’s get right into this time, as there are a lot of charts & videos to cover here with the metals:
Gold 5-year daily chart.
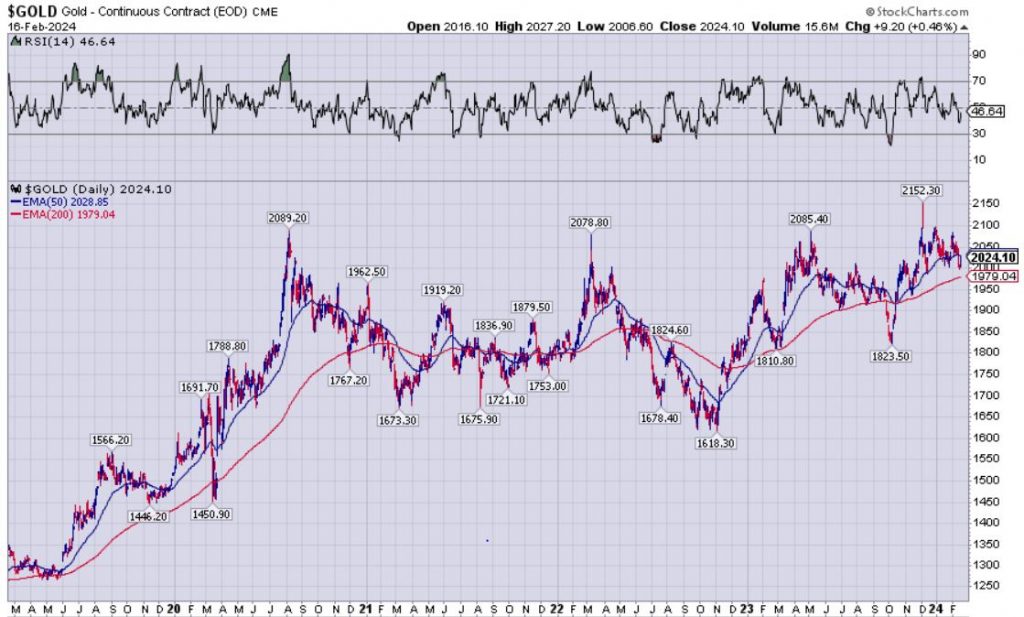
“Knocking on heaven’s door”– With a number of attempts to definitively break up through $2100, we are still waiting for the catalyst to really break the yellow metal out to all-time highs, with some sustained momentum, to really get the precious metals sector moving.
Gold 1-year weekly chart:
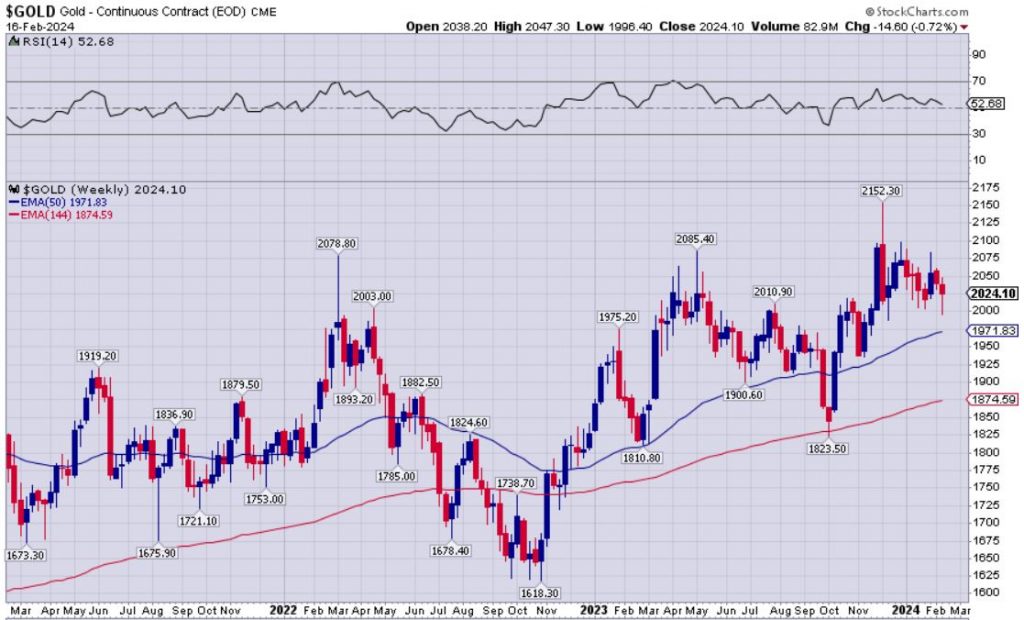
On the gold weekly chart, it’s still in a constructive posture, showing a pattern of higher intraday highs ($1975.20, $2085.40, $2152.30) coming out of the low of $1618.30 back in November of 2022. Gold price closed well above the 50-week EMA, currently at $1971.83, and the 144-week EMA at $1874.59. I included the 144-week EMA which is a Fibonacci level, as that seems to offer more pricing support than the normal 200-week EMA does on the gold weekly chart.
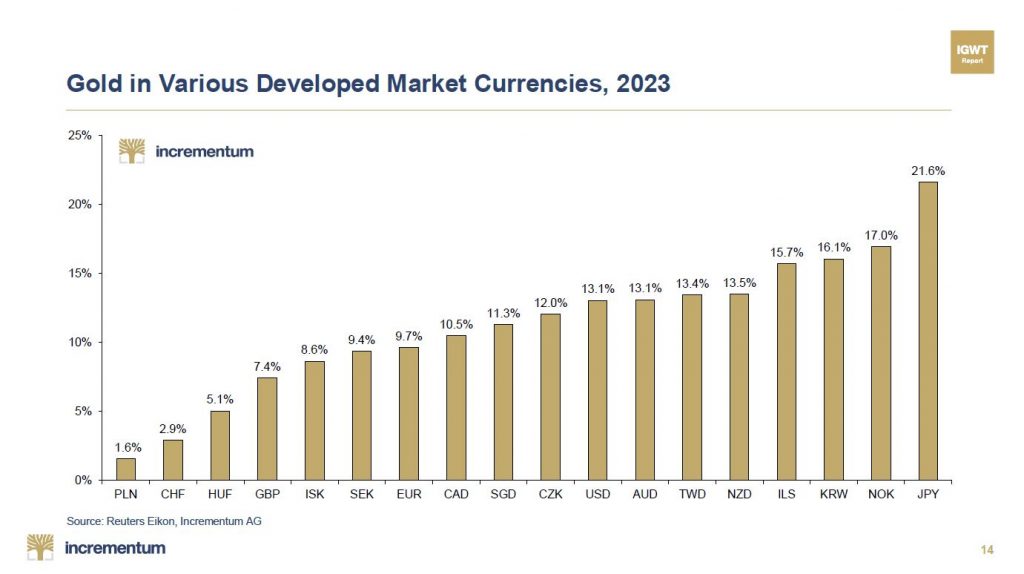
- The guys over at Incrementum put out their January “Gold Compass” report, and it had this fantastic chart embedded that is worth sharing here on how well gold performed last year in a number of global currencies.
Ronald-Peter Stöferle & Mark J. Valek – Monthly Gold Compass – January 2024
- 2 weeks back, over at the KE Report, we recorded an interview with “Doc” Postma, on how he is viewing the longer-term timeframe charts on Gold pricing and the rest of the PM sector. His view extends out over the next few months to next 2 years, so it is still relevant to share here for consideration.
Richard “Doc” Postma – Technical Outlook On Gold, GDX, Silver, Franco-Nevada, Newmont, and Hecla
Silver 5-year daily price chart – Sideway channeling continues
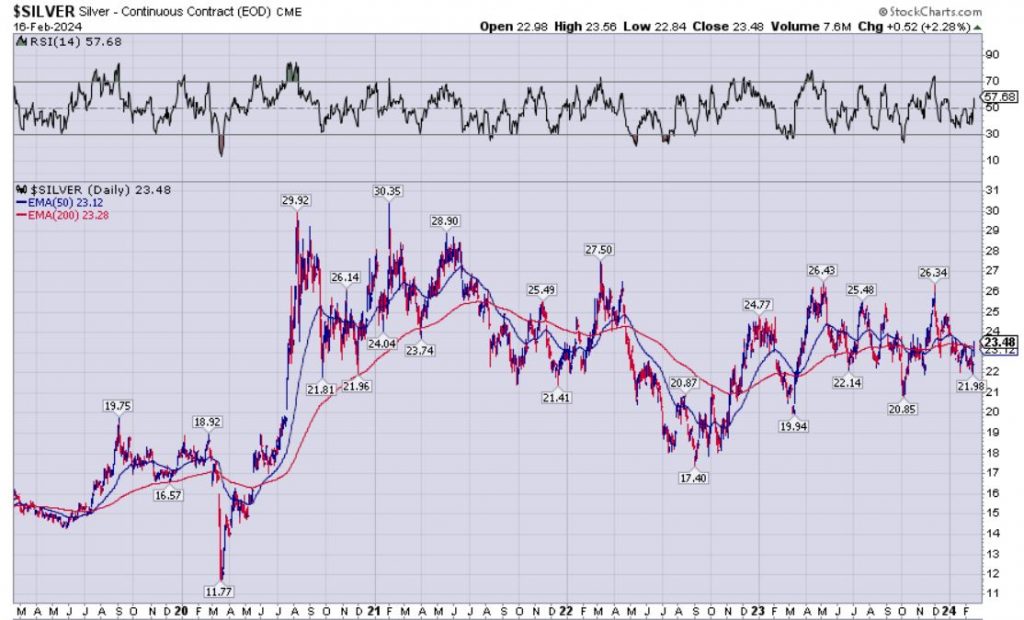
Silver has been stuck in a boring sideways channeling range that has mostly been a pricing whipsaw between $20 and $26.40 for a few years, with the exception of the brief dip down to $17.40 in September of 2022. The only real excitement has come from traders playing the range with position trading.
Silver 1-year weekly chart:
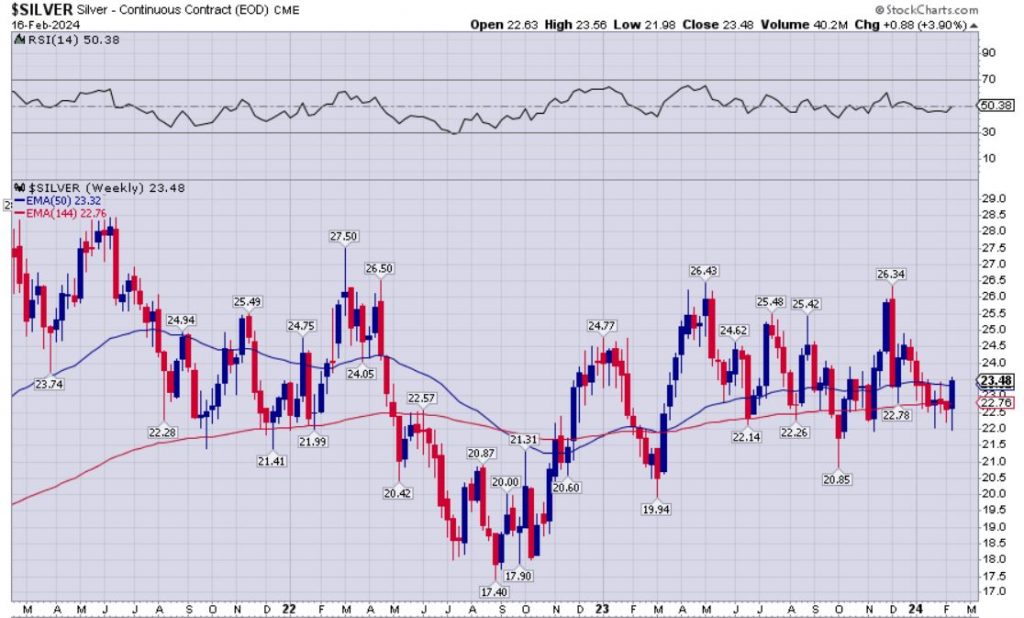
Silver closed the week at $23.48, both above the 50-week and 144-week EMAs. RSI neutral at 50.38. At this point we are just waiting for some catalyst to break Silver out of it’s slumber.
- We had an engaging discussion with Craig Hemke, of TF Metals Report, earlier this week where he is seeing some data in the Commitment Of Traders (COT) Report that is encouraging for a tradable rally, and we did, in fact, see that in the later part of last week.
Craig Hemke – Breaking Down The Silver COT Report To Reveal When Markets Turn
GDX 1-Year Daily Chart:
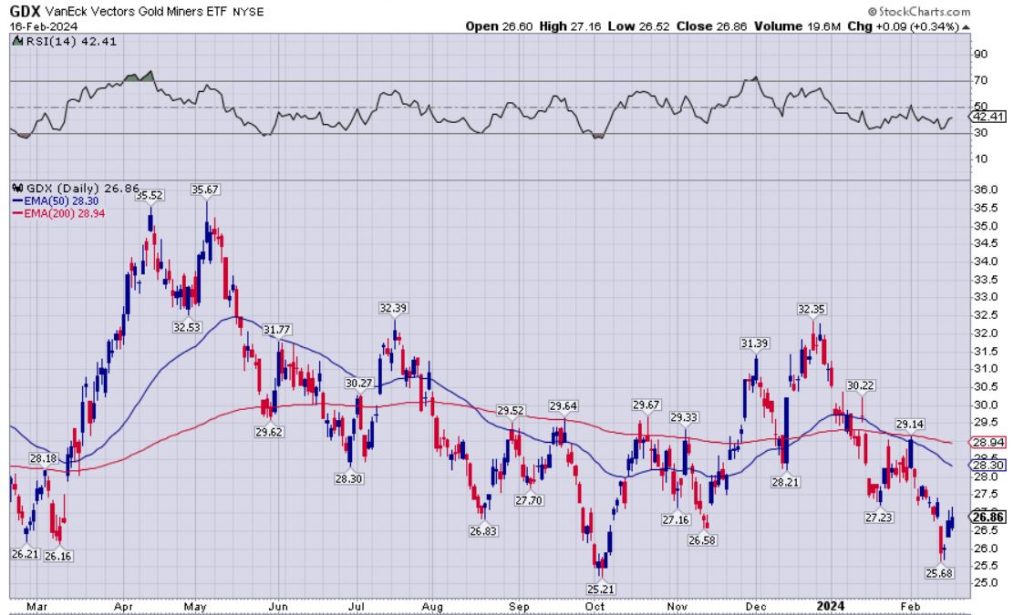
GDX still with a bearish bias, closing the week at $26.86, which is solidly below the 50-day at $28.30 and even further below the 200-day EMA, currently at $28.94. It should also be noted that that the recent low at $25.68 is pretty close to that October 2023 low we saw at $25.21, so it’s possible that could act as a double-bottom of sorts. If GDX was to break below that October low then it would be an even more bullish signal, so bulls want to see the pricing build on the gains at the end of last week to get out the danger zone.
- We had a really great update call with Michael Oliver on how he is seeing a slightly different setup with regards to technical momentum in Gold and GDX. This link should jump listeners to that part of the interview (at 10 minutes : 42 seconds).
Michael Oliver – Technical Momentum Setup In US Equities, Gold, GDX, Energy, and Grains
GDXJ 1-year Daily Price Chart:
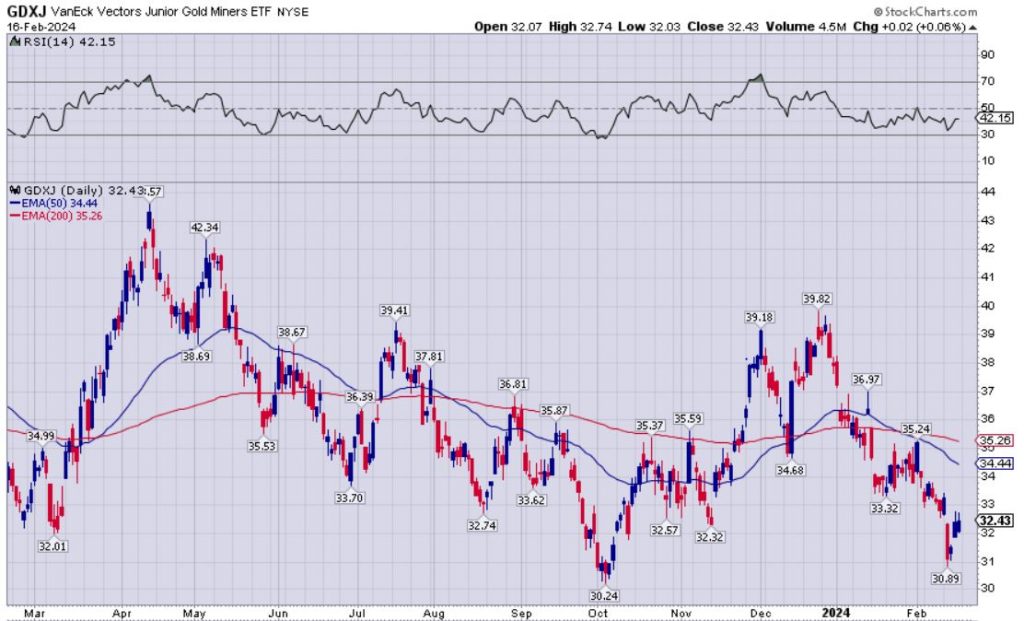
GDXJ, once again, similar to GDX, where pricing performance has been underperforming and it’s in a bearish trend. GDXJ closed the week at $32.42, well below the 50-day EMA, currently at $34.44, and below the 200-day EMA at $35.26. Additionally, the recent low at $30.89 got down dangerously close to the $30.24 level from last October, and bulls will want to see the gains the last few trading sessions of last week built up to the upside to avoid breaking down to a lower low.
SILJ 1-year daily price chart:
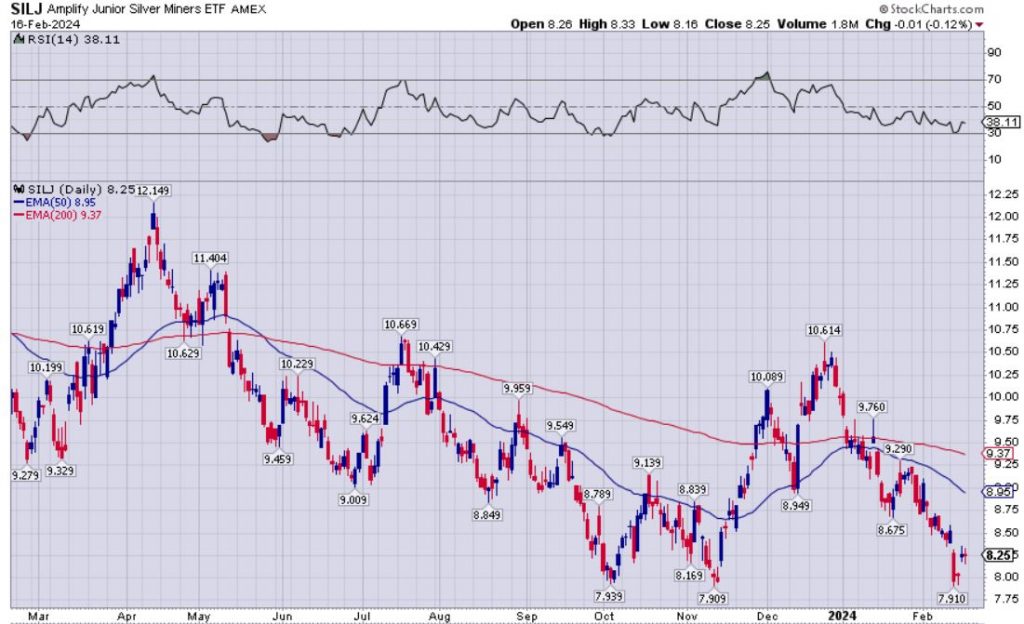
SILJ is the ugliest chart in the litter of PM ETFs, but certainly is not expensive at this point. The SILJ closed on Friday at $8.25, way under it’s 50-day EMA at $8.95, and the 200-day EMA at $9.37. It has a lot of work to do to blast back up through those 2 levels of resistance to get into a more bullish posture. Also, just like we are seeing on the GDX and GDXJ chart, SILJ’s recent bottom at $7.91, was very close to October’s low at $7.93 and November’s low at $7.909. Again, this $7.90 area is key support that bulls do not want to see broken to the downside or it sets up an even more bearish picture.
Copper 5-year daily price chart:
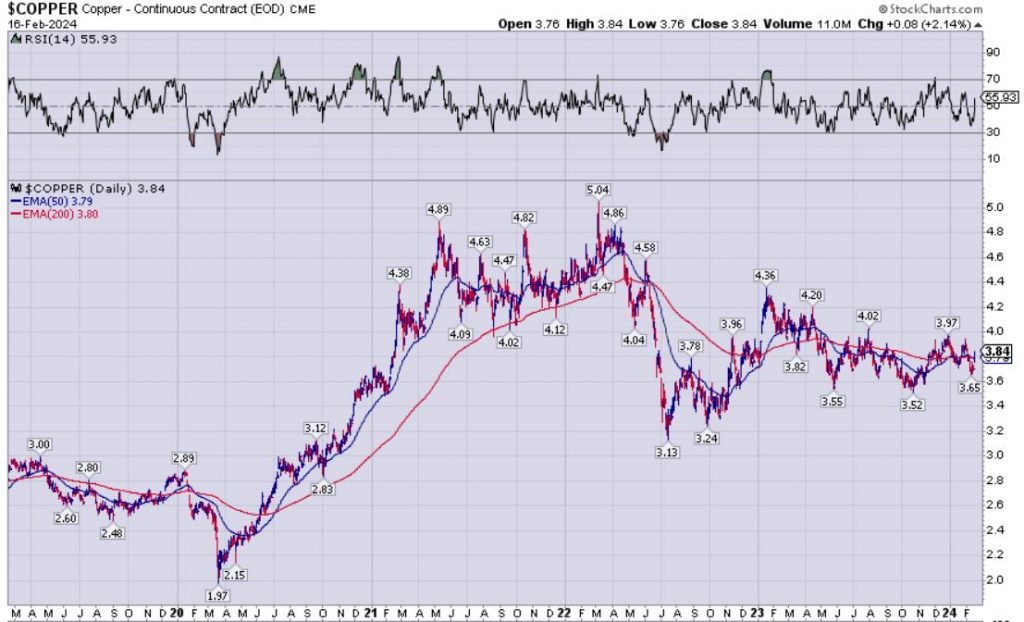
Copper – has remained pretty boring the last 2 years, ever since the fireworks vaulting it over $5 in early 2022, only to drop down to $3.13 just a few months later, and eventually climb back up into a sideways channeling price range from around $3.50 – $4.30 from late 2022 to present. Copper futures prices closed on Friday at $3.84, just barely above the 50-day EMA at $3.79, and the 200-day EMA at $3.80, but at least it was a break up through those EMA’s at week’s end.
COPX – 4-year daily price chart, coming out of it’s pandemic crash lows:
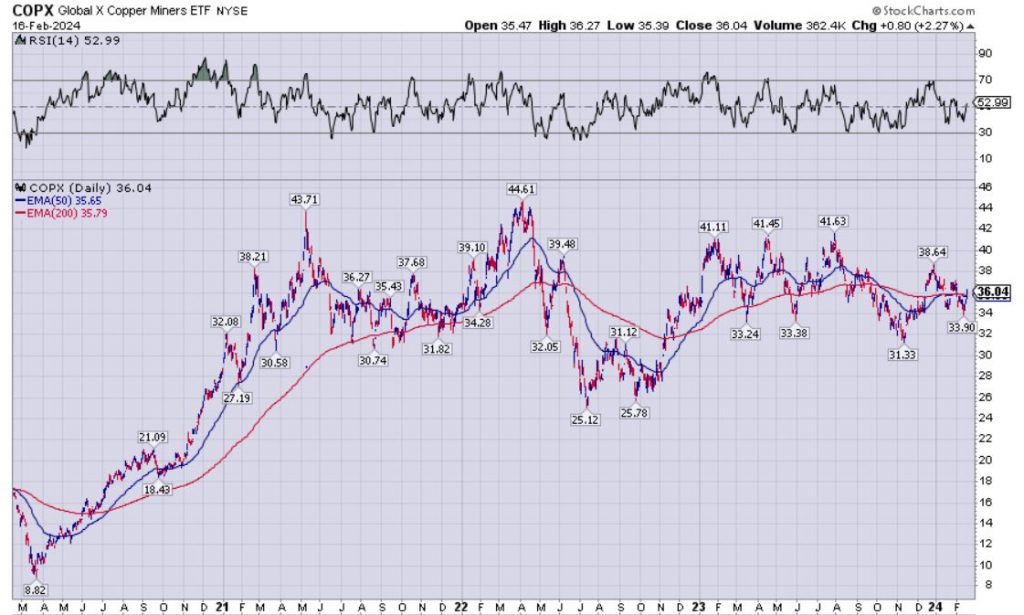
COPX after ripping higher for 2020 – mid 2021, and admittedly holding onto most of those gains, has been more or less rangebound between $30-44 ever since, (with the exception of the brief double-bottom lower in mid 2022). COPX closed on Friday at $36.04, a little above both the 50-day EMA at $35.65 and the 200-day EMA at $35.79, and right in the middle of that trading range.
Nickel 4-year daily price chart:
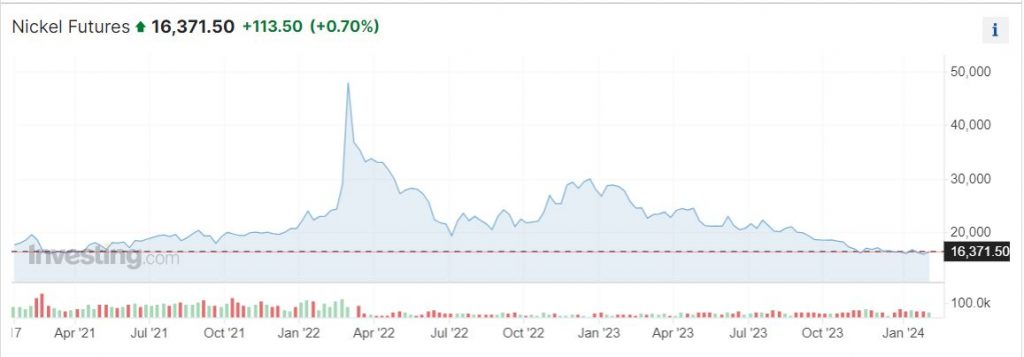
Nothing much to say about Nickel, except that other than that brief spike we saw back in 2022 to record levels, it has been in a steady decline overall since then, with a notable pop in Q4 of 2022 – Q1 of 2023. With depressed nickel prices, it has really sucked most of the sentiment out of investors looking at nickel-related resource stocks, but we’ve noted an increased optimism in the nickel equities as a contrarian trade from a few of our guests on the KE Report.
Doc Jones – Investment Opportunities in Nickel, Copper, Gold, Oil, and Nat Gas Resource Stocks
Erik Wetterling – Talking Nickel Fundamentals And Nickel Stocks With The Hedgeless Horseman
Brian Leni – The Good and Bad Of Bull Markets; Nickel, Lithium, Uranium
Rick Rule & Jesse Felder – Silver, Uranium, Nickel and Gold Miners
That wraps us up for this Week In Review on the metals and the mining stocks, and I appreciate you reading through. Now that we’ve wrapped up the 4-part series entitled Part 8 (A,B,C,D), expect us to break out a number of these sectors and individual opportunities in each sector as well as weaving back in some of the macroeconomic drivers in the weeks to come.
To view this article or subscribe to my free Substack page click here:
https://excelsiorprosperity.substack.com/p/gold-silver-copper-nickel-week-in
Ever Upward!
- Shad
Much appreciated CaliJoe.
I’m 100 percent convinced that the current bear market sentiment in PM stocks won’t end without having a catharsis type event where everything will be on fire sell.
I feel like we already had that catharsis type event in Gold & Silver back Sept-Nov of 2022.
Sept of 2022 was the break in Silver down to $17.40 (which was it’s bottom. It then popped out of there with a scorching short-squeeze, and then the PM mining stocks (both gold and silver) followed it’s lead up higher starting in late September for about 7 months after that.
Gold took a while to confirm the PMs were on the move and didn’t actually bottom until Nov. 4th 2022, at $1618 but then it went on to also rocket higher by $400 in just a few months. That was the bear trap, where so many analysts and commentators thought that because the key $1675 support had given way, that it was going to be breaking down through the pandemic crash low of $1450 and the prior key areas of prior resistance/ and now support $1375. Well…. none of that happened, and instead the PMs just kept on rallying.
Really from late September of 2022 – through banking crisis in March/April of 2023 last year was a epic move higher in most of the more widely followed mining stocks, in tandem with the metals having such a serious reversal to the upside and catching all the bears off sides. That was the catharsis moment.
Gold closed 2023 with the highest weekly, monthly, quarterly, and annual close on record. That is about as bullish of a signal as anyone could hope for on the longer term charts.
So despite the continued malaise and weakness in the PM stocks (more tied to Silver’s funk and rangebound trading than any issues with Gold), the worst is behind us and any further weakness should be accumulated.
Great stuff, Shad…wish I could be half as productive…
Sorry to change topics but could you tell me what that horrible Akismet software has against the great Jimmy Bovard??? And could you release the post in the Orphan Section? Thank you…
Thanks Ebolan. As far as the post held in the cue, I just went up and released it after I saw your comment.
You can always email me (shad@kereport.com) if something goes into moderation again, without posting here on the blog. I’ll be able to respond to those more quickly.
Thanks, Shad…and if you get a chance to take a break from content creation….have a listen to Jimmy Bovard…he’s a hoot…
Thanks for the heads up Ebolan. 🙂
I put out a “Special Alert” to subscribers of my Excelsior Prosperity channel over at Substack this morning.
_______________________________________________________________________________________________________
Special Alert – Uranium Stocks Magnetically Drawn To The 50-Day Moving Average
Excelsior Prosperity w/ Shad Marquitz – 02/19/2024
https://excelsiorprosperity.substack.com/p/special-alert-uranium-stocks-magnetically
Global Export Restrictions Will Squeeze Uranium, Nickel, and These Commodities
Commodity Culture – February 16, 2024
00:00 Introduction
00:26 Outlook on Uranium
05:55 Bullish on Nickel
09:51 Gold and Silver
15:25 The Market is Not in a Bubble
20:43 Don’t Bet Against America
26:15 The Fed’s Next Move
31:21 Deglobalization and Commodities
Hi Ex, what is your take on The PDAC curse, it is now less than two weeks away. DT
Hi DT. I feel like the seasonality patterns are off this year, where we saw a big run from late October through December in Q4, in what is typically tax loss selling season, and then the pms have struggled during the Q1 Run in Jan & Feb in what ate typically some of the more bullish months of the calendar year. So, since we didn’t get the year-end corrective move, followed by a early-year slingshot move higher, then I’m just not seeing the energy to work off with a typical PDAC curse.
It seems like markets (as well as interest rates, dollar, gold, commodities) on hold waiting for clarity on Fed monetary policy loosening…. likely through mid-year.
Hi Ex, thanks for the feedback, I concur with your thoughts! DT
Shad, Excellent summary!